Author: Sword of Damocles
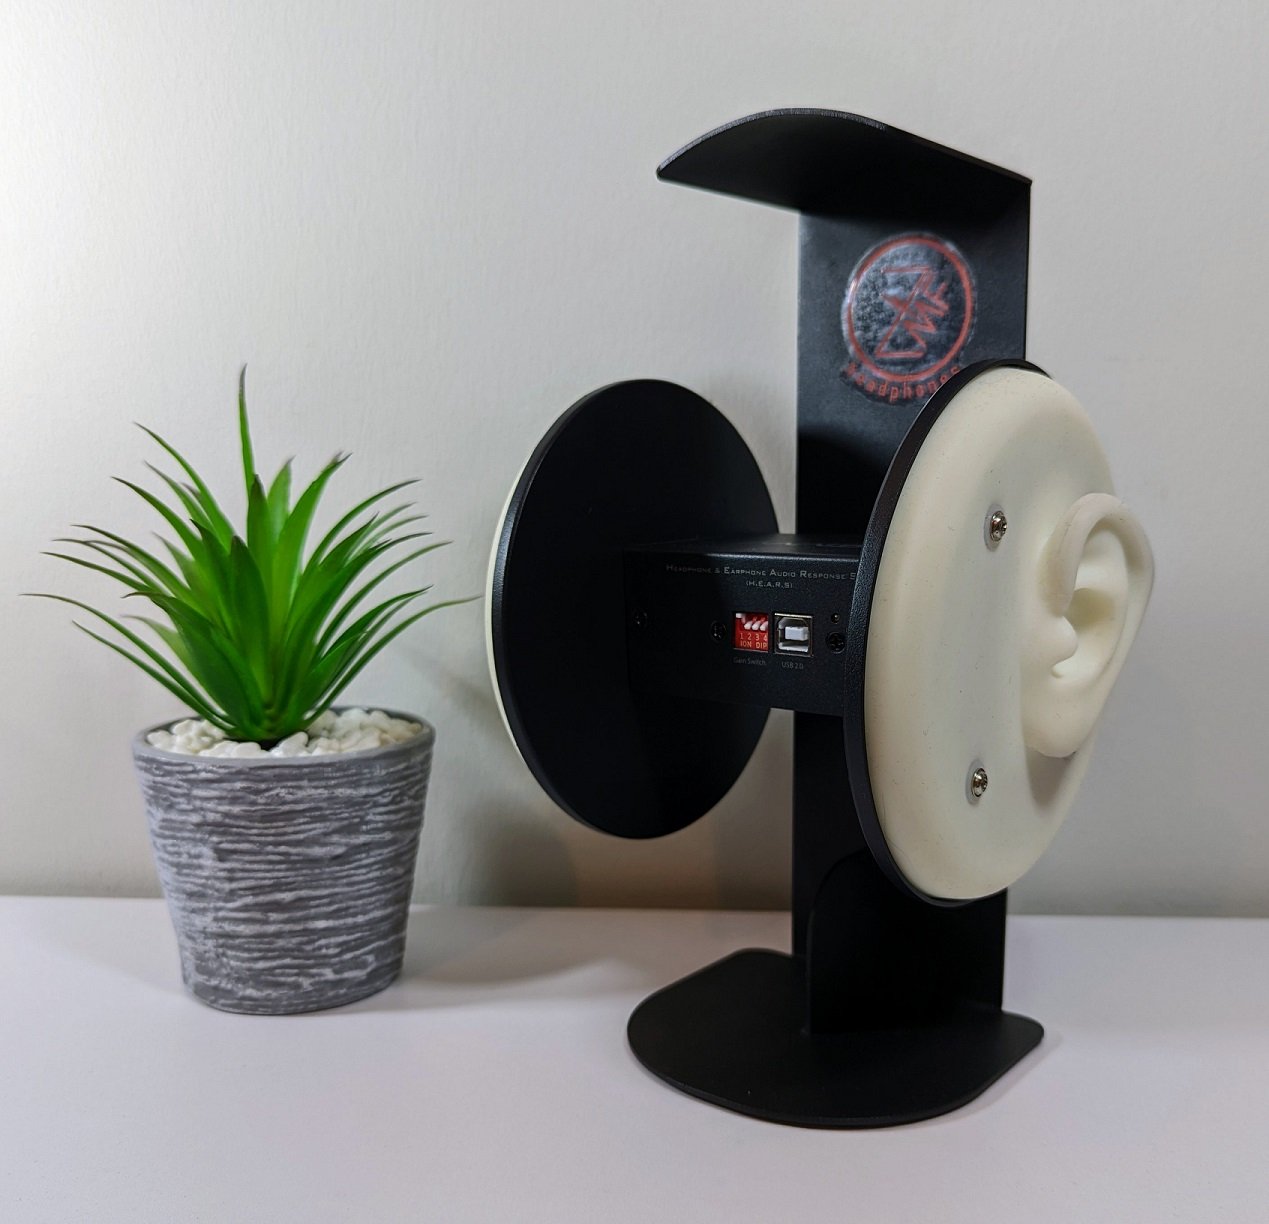
Table of Contents:
Our headphone reviews nowadays almost without exception include frequency response measurements, which we perform using the EARS (Earphone Audio Response System) measurement device (the device itself says HEARS). We have often reminded about the inaccuracy of the device, so in this article, we will take a closer look at what kind of device it really is and how to interpret the measurement results it produces. I bought my own EARS device from Finland from aaninen.fi -website. I thank Jussi Hoffrén for the good service and the small discount I received!
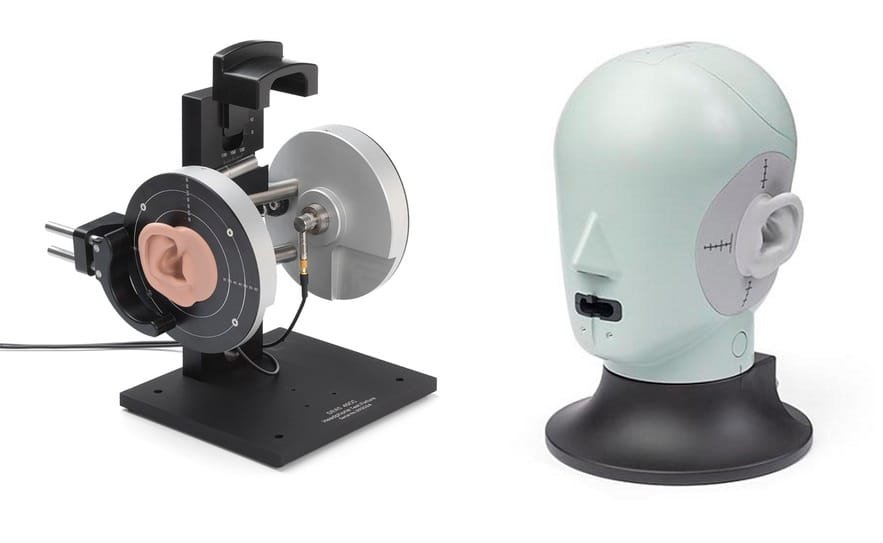
EARS is by no means a device designed for professional use in terms of accuracy; its biggest advantage is its affordable price of about 250 euros. This makes it significantly more attractive for hobby use than devices costing thousands or even tens of thousands of euros, such as GRAS and Brüel & Kjaer.
Without an easily obtainable measurement device like EARS, headphone frequency response measurements would remain more or less with commercial operators and review sites. Now, many headphone enthusiasts also have the opportunity to verify what kind of frequency response their own headphones have. In my opinion, this increases transparency between headphone manufacturers and headphone buyers.
EARS was originally designed as a tool for headphone equalization, but measurements made with it, when done and interpreted correctly, also increase a more general understanding of headphone sound and the differences between various headphone models. Additionally, the device can be used to identify defects in headphones, such as unusually large channel imbalance, high distortion values, or a malfunctioning driver. This is beneficial in potential warranty and service situations.
The benefits of EARS do not, however, negate the fact that the reliability of the frequency response measured with it varies greatly depending on the measurer and the headphones being measured. For this reason, many believe that frequency responses measured with the device should not be published at all in conjunction with reviews, as readers might perceive the measurement results as accurate and truthful, which they never are.
However, in Kuulokenurkka, we do not see this as too big a problem, because frequency response measurements, in addition to our subjective observations, form only a part of the evaluation of headphone sound quality. Despite their inaccuracy, the measurement results obtained with EARS are sufficiently indicative to highlight the sonic characteristics and potential shortcomings of different headphone models. The frequency response also often serves as additional confirmation for our own observations – for example, for some of the headphones we review, there are hardly any measurements made with better devices.
Introduction to the device
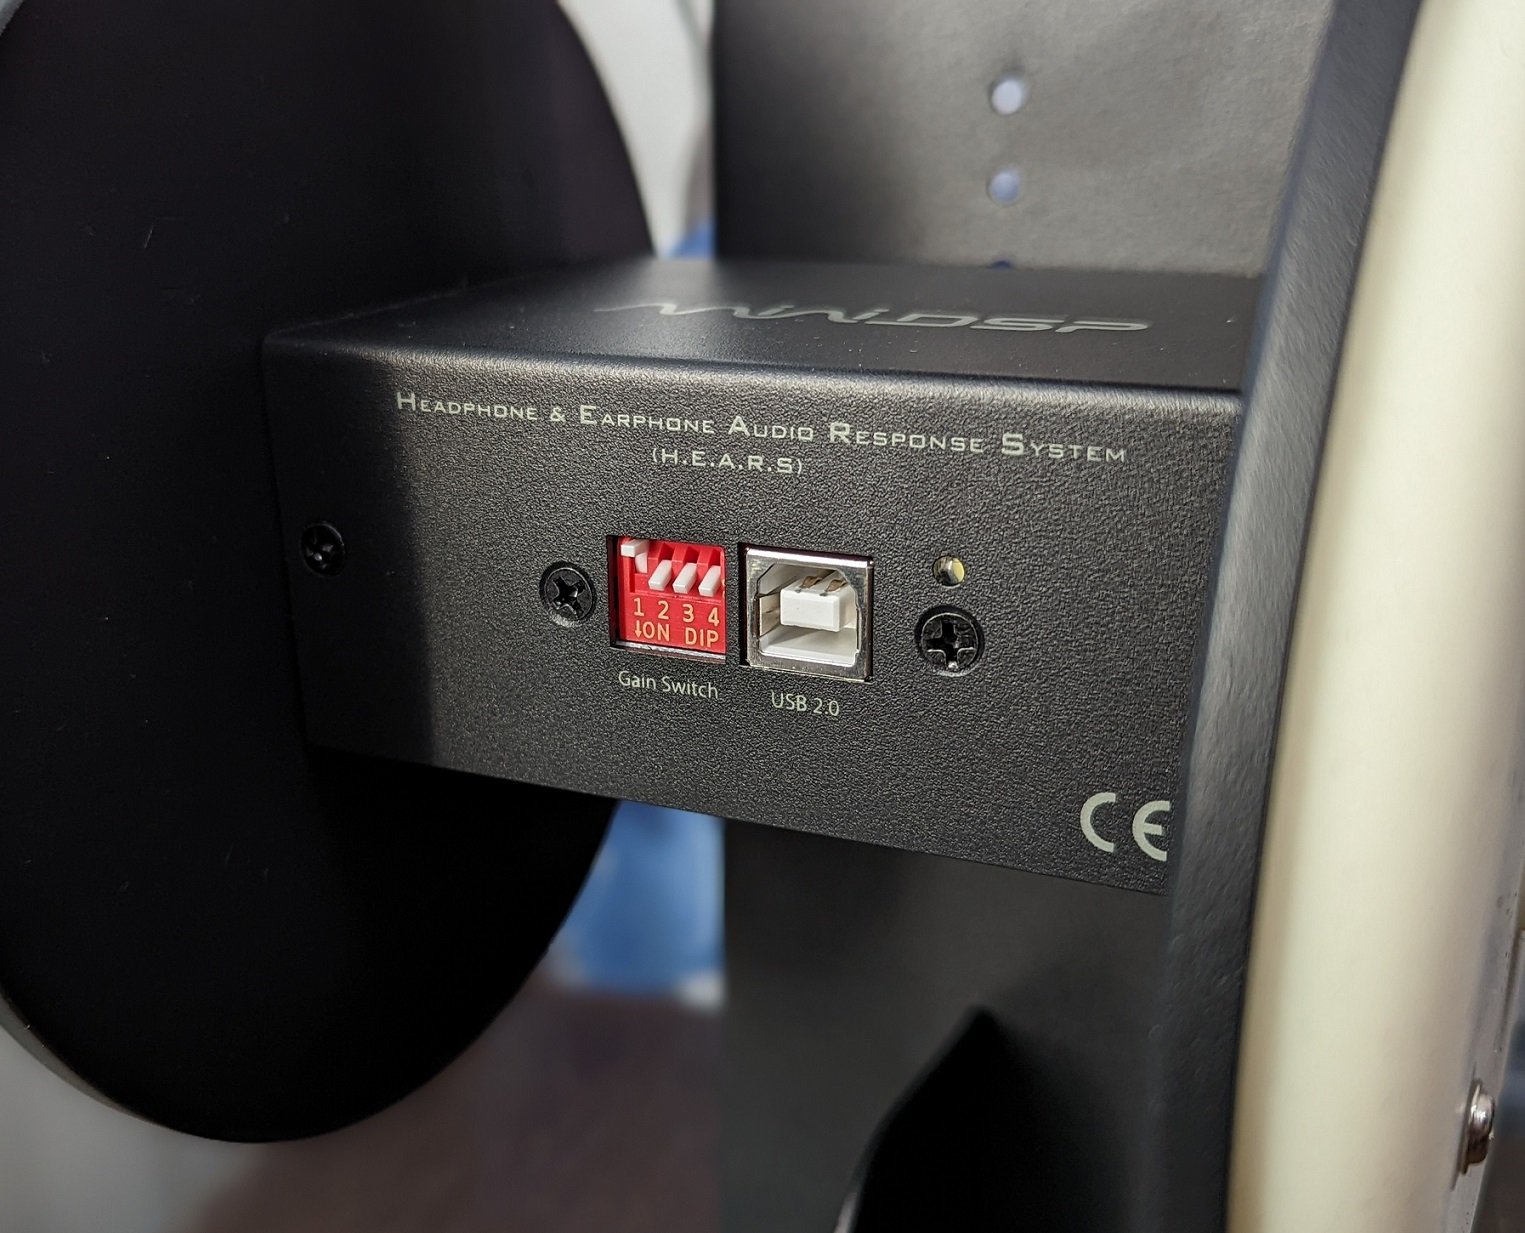
The MiniDSP EARS is externally a simple device, as it consists of a metal frame and a measurement unit, which has a microphone and a silicone artificial ear on both sides. At the front edge of the device, there is a USB connector for connecting to a computer. To the left of the connector are four switches that can be used to adjust the sensitivity of the microphones if necessary. It would also be possible to adjust the height of the measurement unit and the artificial ears attached to it, but in reality, it is easier to adjust the appropriate height from the headphones being measured. The use of EARS usually involves no other preliminary steps than connecting the USB cable to the computer.
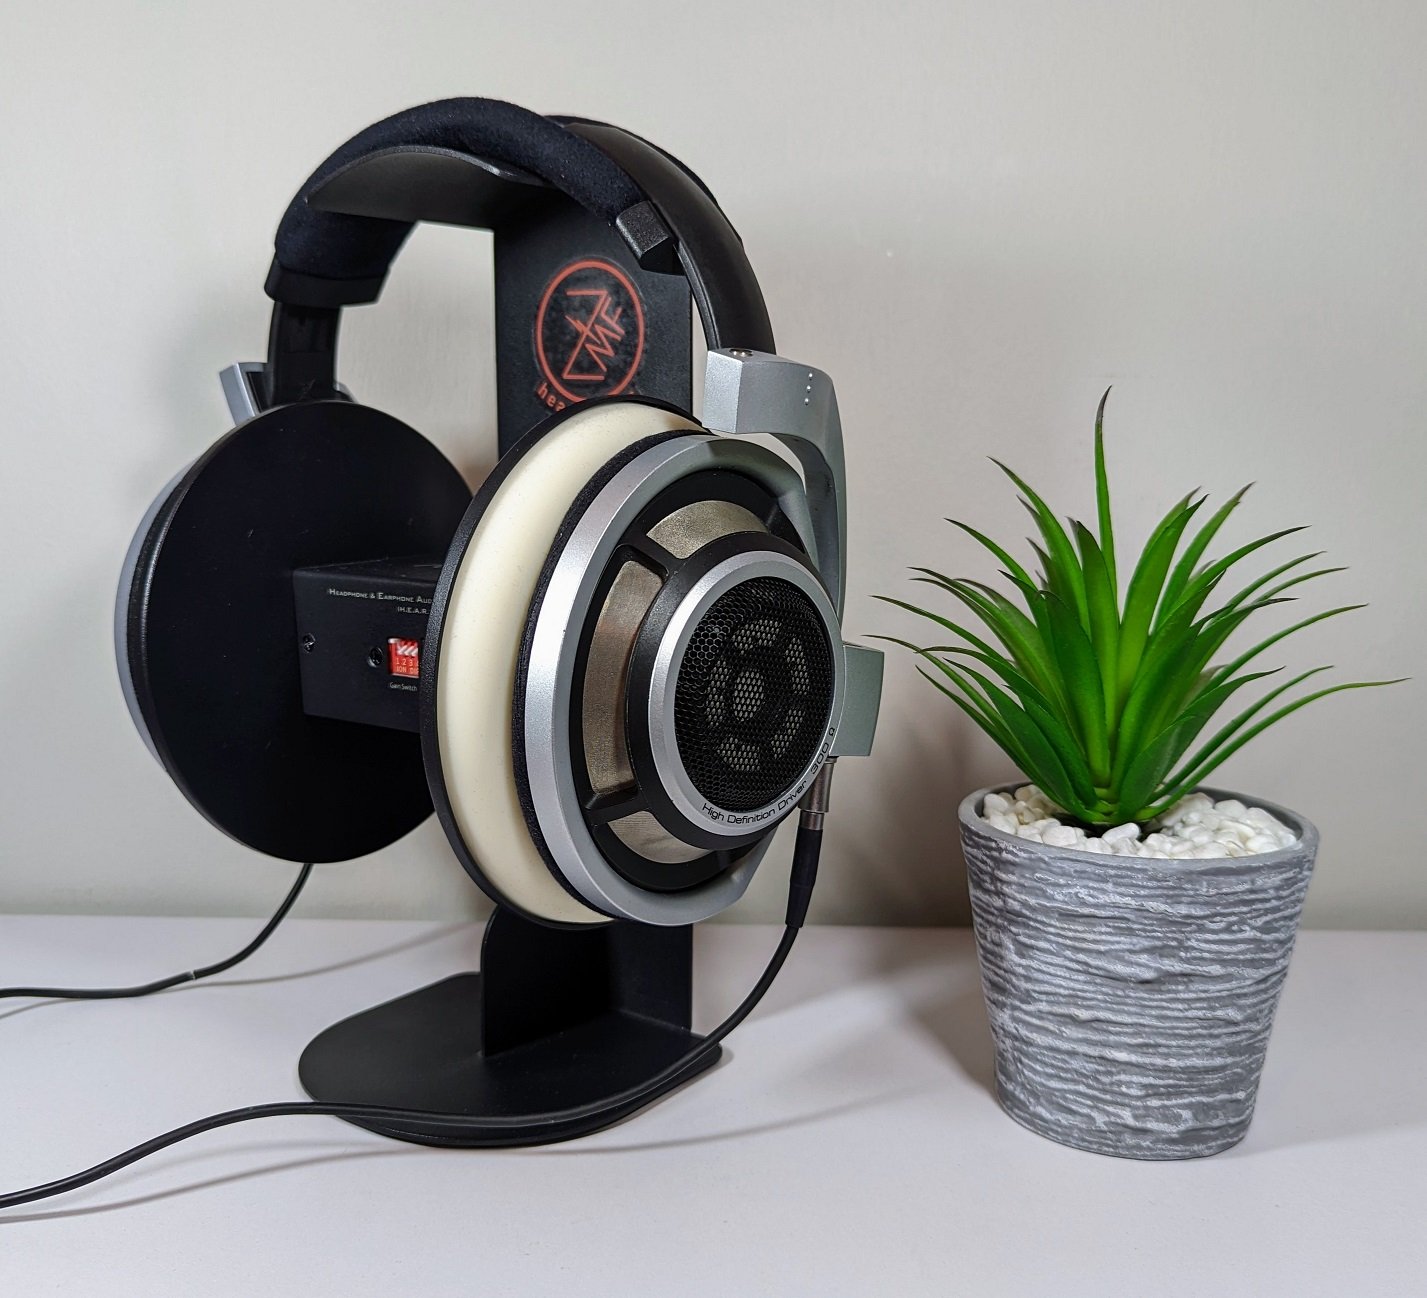
The first weakness of the device's physical structure is its too narrow width, due to which many headphones do not press firmly and tightly enough against the device's artificial ears. When measuring some headphones, they have to be pressed more tightly against the device's ears so that no air gap remains between the device and the ear pads, which would particularly affect the measurement of bass frequencies.
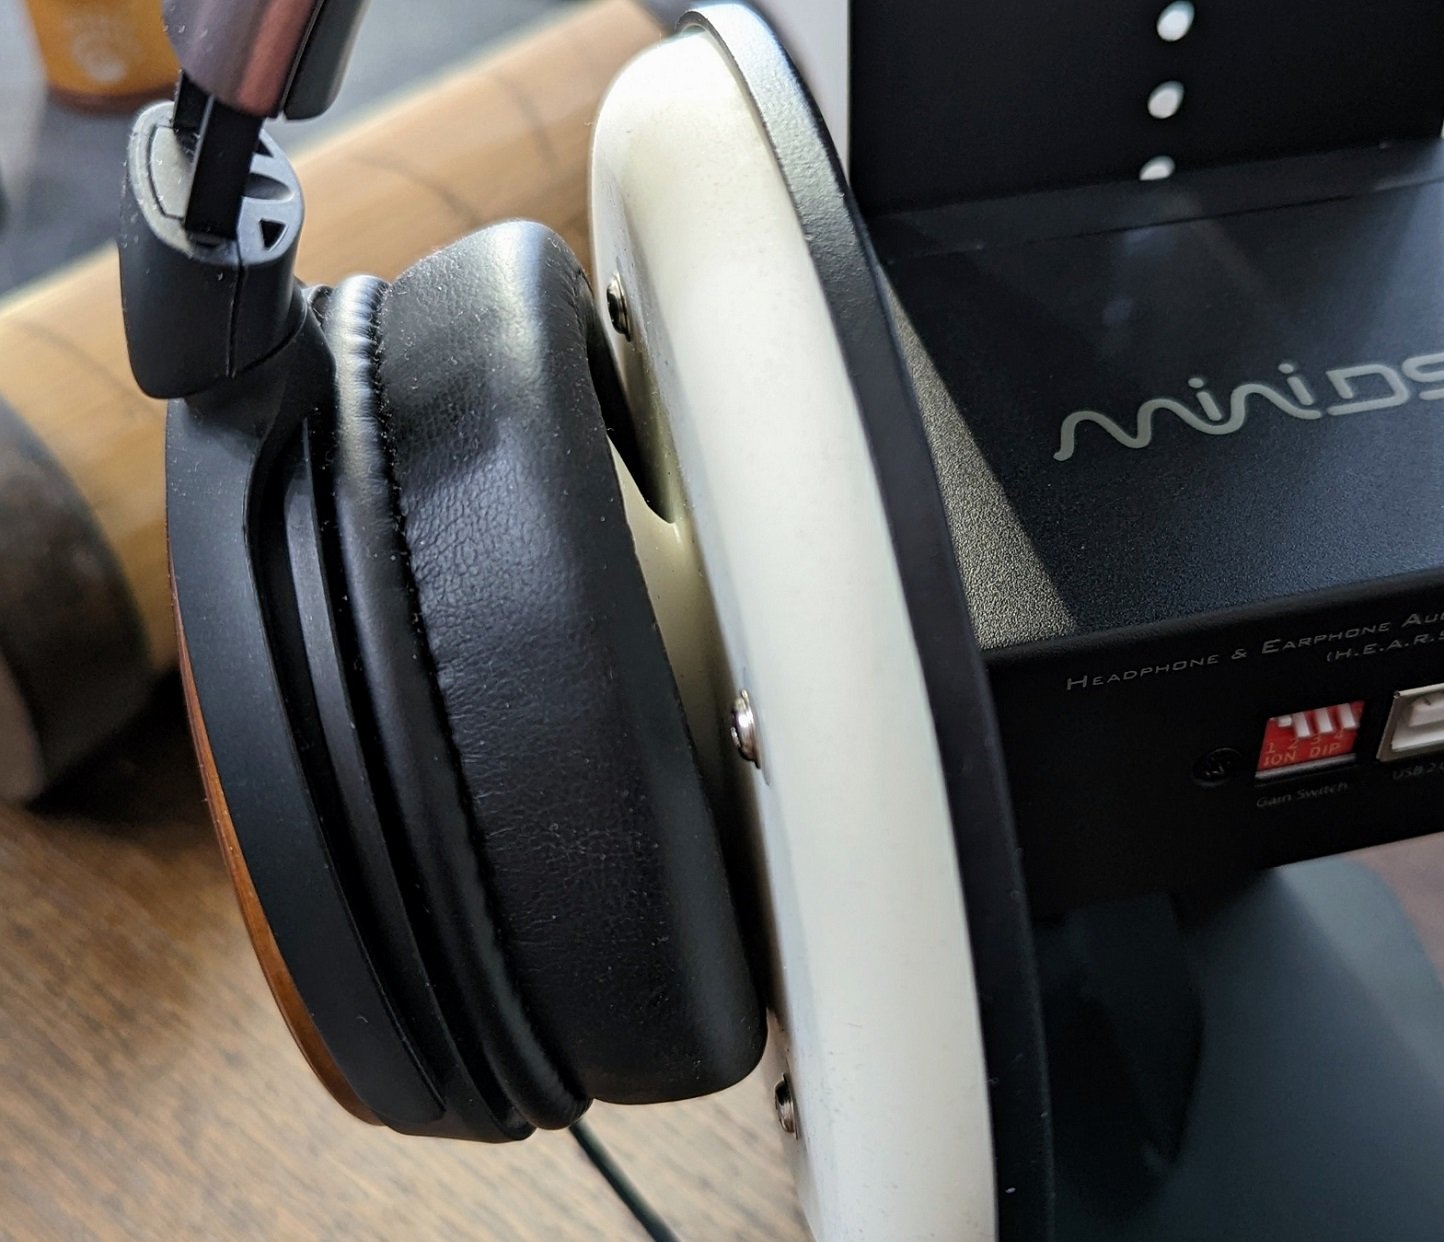
The flat silicone plates around the EARS artificial ears also do not resemble the shape of a human head, which further degrades the fit of some headphones during measurement. I am also annoyed by the four screws used to attach the silicone part, which protrude slightly exactly where the headphone cushion is supposed to rest.
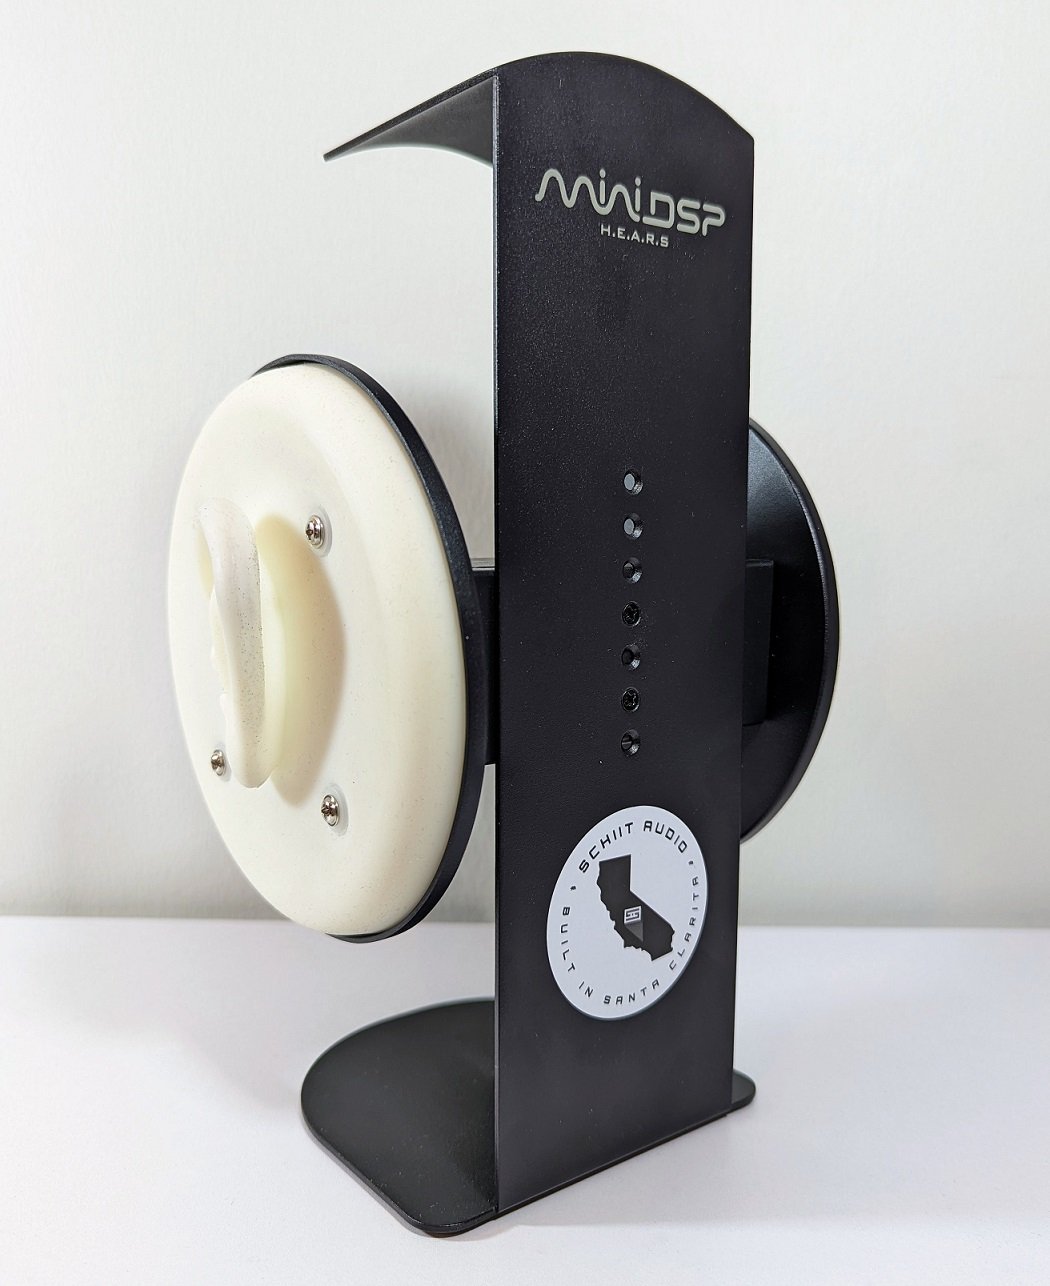
Part of the significantly higher price of devices designed for professional use is explained by the realistic shape of their artificial ears and an internal structure that mimics the human ear. The affordable price of MiniDSP EARS is particularly evident in its artificial ears being externally quite crude, thick, and hard. Because of this, on-ear headphones that rest on the ears fit poorly on the device's ears, making measurement difficult. The same problem also applies to over-ear headphones with small ear openings in their cushions.
The EARS' ears do not have any internal structure resembling a human ear; instead, inside the ears, there is only a straight hole with a microphone at the bottom. Attempts have certainly been made to compensate for the structural deficiencies with software, but the result remains a rough generalization of how human anatomy would affect the final sound of headphones. However, the EARS artificial ears are better than nothing, considering the device's affordable price.

In addition to traditional headphones, in-ear headphones can also be measured with the device by placing them in the artificial ear's tubular canal. Besides performing various measurements, it would be possible to record binaural audio with the EARS' two microphones, in which case the result, when listened to with headphones, would resemble the three-dimensional soundscape a person hears in real life. To my understanding, the result could be interesting, but I haven't had time to try such recording yet.
Device usage
MiniDSP does not offer its own software for its measurement device, but measurements can be easily performed with the free REW software (Room EQ Wizard). Individual compensation files (two text files), downloadable from MiniDSP's website using the EARS device's serial number, are fed into the software. These files correct microphone frequency errors and facilitate the interpretation of measurement results. There are several different compensation options for the device, which I will explain in more detail immediately after this section.

We perform frequency response measurements with the settings recommended in the MiniDSP user manual, setting the volume of all headphones to approximately 84 decibels at a frequency of 300 Hz using the REW software tools. During the measurement, the software plays a sound wave from 20 hertz to 20,000 hertz to one ear at a time. The EARS device's microphones listen to this sound, and REW draws a frequency response curve based on the recording and the selected compensation.

The position of the headphones on the measurement device often has a significant impact on the result, so we perform measurements according to recommendations in several different positions, especially if the headphone model being measured appears to react sensitively to changes in position. Sometimes individual measurement results turn out to be ”outliers” that clearly deviate from other results, indicating more about the incorrectness of the measurement position than the headphones' true frequency response. We disregard such exceptional cases when determining the final frequency response.
Because variation arises between measurement sessions due to the measurement position and MiniDSP EARS' own inaccuracy, we present frequency responses in our headphone reviews as an average formed from several measurement sessions (there is a ready-made button for this in the REW software). We always first calculate the average separately for the left and right channels to determine the variation and balance between the channels.

However, channel balance is individual for each pair of headphones, so we generally present the final frequency response as the average of the two channels. We believe this better reflects the general frequency response of each headphone model. In some cases, such as in the review of the Audeze LCD-2 model, a greater channel imbalance has, however, been important to highlight, as it significantly affected the evaluation of the headphones. Smaller variations, on the other hand, usually go unnoticed when listening, although some listeners detect them more sensitively than others.
Despite averaging, the frequency response curve often still looks quite rough, as it contains a lot of small ”vibrations” whose accuracy makes it impossible to draw more precise conclusions due to the inaccuracy of EARS. To make the end result cleaner and easier to read, we will finally apply smoothing to the frequency response curve using REW software's Smoothing tool. MiniDSP recommends the 1/12 octave smoothing method, which we have found to be effective as it does not over-smooth the frequency response.

Compensation options
The various compensation options offered by MiniDSP facilitate the reading and interpretation of measured frequency responses. Since the compensation files downloadable from the manufacturer's website are traditional text files, a more skilled EARS device user can also modify them to create a different compensation, for example, based on their own preferences. Next, I will present the options offered by the manufacturer.
Kompensations over-ear and on-ear headphfor whom/which
RAW measurements:
The device can perform so-called raw measurements using RAW compensation, which only corrects the frequency errors of the microphones. In this case, the frequency response is roughly comparable to raw measurements from other sites, but the RAW frequency response curve does not take into account at all how the human ear perceives sound, and what headphones actually sound like to us. Overemphasized frequency ranges in raw measurements are desired, because in headphones that measure flat, the same frequencies would sound too faint to us.

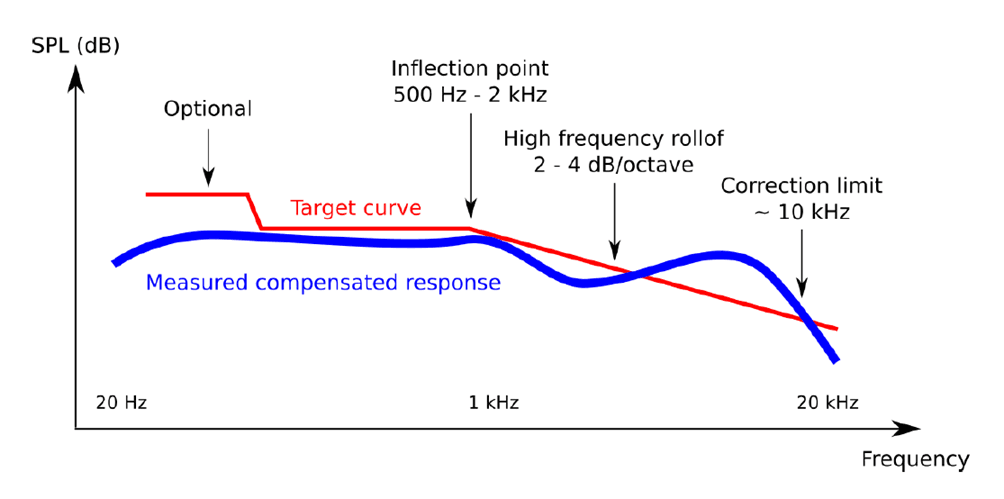
HEQ compensation (in use in Kuulokenurkka):
To better understand the frequency response measured with MiniDSP EARS, the measurements are intended to use the HEQ and HPN options offered by the manufacturer as compensation. Of these, HEQ (Headphone EQ) has become more popular, which according to the manufacturer roughly corresponds to Harman's target curve (apparently the 2013 version), which has become a kind of standard compensation among professionals. All the largest and most well-known websites that perform headphone measurements present their frequency response measurements compensated to Harman's target curve – some may, of course, use their own modified Harman compensation.
Unfortunately, MiniDSP does not reveal in more detail how its HEQ compensation target curve differs from Harman's target curve, so measurements made with EARS cannot be fully compared to it. On the other hand, the measurement accuracy of EARS does not otherwise meet the IEEE standard, so frequency responses measured with it are not intended to be considered as reliable as responses measured with professional-grade equipment.
In HEQ compensation, a frequency response drawn as a perfectly straight line would reflect sound that subjectively sounds as neutral and balanced as possible to the human ear. Since this would also be approximately in line with Harman's target curve, a frequency response measuring as a straight line can be considered a justified goal in HEQ compensation, which would sound good to most people.

In reality, however, EARS measures higher frequencies particularly inaccurately to such an extent that a linear frequency response does not occur even with almost perfectly neutral headphones. For this reason, the target according to HEQ compensation should only be considered a rough reference, which indicates which frequency ranges in the sound of each measured headphone are emphasized more than others. In any case, the frequency response is easy to read keeping the linear target in mind.
HEQ compensation is actually designed as an aid for headphone equalization, for which it is, in my opinion, well suited – the end result should, of course, always be checked by listening to the headphones. For example, when equalizing with Equalizer APO software, headphones can be placed on the EARS device, which makes it easy to check the effect of the changes made on the frequency response. Since there is a small variation in frequency response between each individual headphone unit, measuring one's own headphones generally leads to a slightly more accurate equalization result than using data from another headphone unit picked from the Internet.
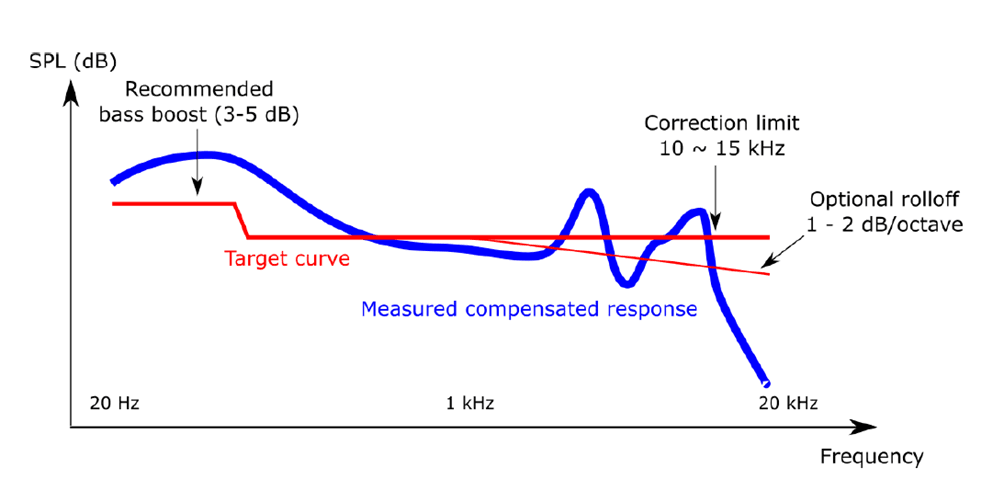
HPN compensation:
Another compensation option offered by the manufacturer is called HPN (Headphone Measurement), whose target curve slopes downwards towards high frequencies. At the same time, bass frequencies rise upwards compared to HEQ compensation.
HPN compensation generally makes all headphones appear bass-heavy, so using it when publishing measurement results can be misleading for those accustomed to HEQ-style compensation. The interpreter of the frequency response, or in other words, for example, a reader of Kuulokenurkka, should know that mid-frequencies and treble, which are lower compared to bass frequencies, are an expected outcome and do not necessarily convey anything about the intensity of the headphones' bass reproduction. Although HPN compensation can be used to draw correct conclusions about the sound of headphones, we always publish frequency responses in Kuulokenurkka using the more commonly used HEQ compensation.

Kcompensation for in-ear headphones
IDF compensation:
Measuring in-ear headphones differs from traditional over-ear headphones, as they are placed directly into the EARS artificial ears. For this reason, they also require a different compensation, which MiniDSP calls IDF (IEM Diffuse Field). Its target curve resembles HEQ compensation, but over-ear headphones and in-ear headphones are not directly comparable when measured with EARS. In Kuulokenurkka, we have not yet measured in-ear headphones, so we will not discuss their measurement practices further for now.
Interpretation of results and EARS's inaccuracies
The average of the right and left channels, created based on several measurements, shows how loudly the headphones reproduce sound at different frequencies. From the frequency response, it can be deduced which frequencies are emphasized or remain too subdued overall. Based on this, general conclusions can be made without listening to the headphones about whether they sound dark, balanced (neutral), or bright. Although the frequency response often reveals other characteristics, the final sound quality of the headphones is fully revealed only by listening to them.
Different frequency ranges are named in software like REW as follows:
- 20–60 Hz: sub-bass (Sub bass)
- 60–250 Hz bass (Bass)
- 250–500 Hz low mid-frequencies (Low mid)
- 500–2000 Hz mid-frequencies (Mid)
- 2000–4000 Hz upper mid-range frequencies (Upper mid)
- 4000–6000 Hz presence region/lower treble (Presence)
- 6000–20 000 Hz upper treble (Brilliance)
If the MiniDSP EARS user has carefully performed measurements with enough different headphone positions, the frequency response is quite reliable between 20–2000 Hz and with reservations also between 2000–4000 Hz. This alone makes the device quite useful, as these frequency ranges tell the most about what a headphone ultimately sounds like. Mid-range frequencies are always the most important element for playback balance.
According to our experience, the measurement accuracy of EARS significantly decreases from 4000 Hz upwards, but the amount of treble frequencies can still be inferred, for example, how much treble there is compared to the mid-range frequencies. Bright-sounding headphones can be identified with frequency response measurements made with EARS, but individual boosts and dips in treble frequencies can be located at quite wrong frequencies depending on the headphone model. For example, a certain boost might be located at 5000 Hz when measured with EARS, while it is located at 7000 Hz when measured with a more precise device.

The device seems to measure the frequency range between 4000–7000 Hz most inaccurately, where a clear dip often also occurs relative to the surrounding frequency ranges. This is most clearly visible in closed-back headphone models (although the examples in the image above are all open-back models), whose cup reflections particularly interfere with the recording of treble frequencies by the EARS microphones. The deep dip formed in the frequency response often simultaneously pulls the 4500 Hz and 8000 Hz regions unnaturally high, so high and narrow peaks at these frequencies should generally not be fully trusted.
Frequency response example interpretation: Sennheiser HD800

Next, I will go through the interpretation of the frequency response using Sennheiser HD800 headphones as an example. This headphone model is generally considered to sound bright and airy, which can also be inferred from its frequency response shown above in relation to the HEQ compensation target curve (line) I drew. If the frequency response were close to the grey line across all frequency ranges, the headphones could be subjectively considered to sound neutral and balanced. However, the HD800 has more high frequencies than the target, so it can be interpreted as bright-sounding, especially when other frequencies fall either on or below the grey target line.
One should never look at only a single sub-area of the frequency response, but rather the broader whole. If, contrary to its current state, the HD800 model also had a very strong boost in bass frequencies, it would also make the headphones subjectively considered bass-heavy. However, the HD800 has less bass than the HEQ compensation target, which further emphasizes the large amount of treble in the overall sound.
It is usually safest to compare the amount of both high frequencies and bass to the mid-range frequencies, for example, at 1 kHz. If either is clearly more prominent than the mid-range, they generally stand out in the overall sound. Conversely, when there is less bass or high frequencies than mid-range frequencies, the mid-range becomes most prominent in the overall sound. Many headphones designed for larger consumer groups have both bass and high frequencies prominently boosted, making them simultaneously bass-heavy and bright-sounding – this kind of tuning is called V-shaped, after the V-like shape of the frequency response.
Because listened music and different instruments are never limited to just individual frequency ranges, it is still very difficult to fully and correctly deduce the final sound of headphones merely by looking at the frequency response. Furthermore, more subjectively experienced aspects, such as soundstage presentation, the separation and clarity of individual sounds, and playback dynamics, are poorly revealed by the frequency response, although some hints can be gathered if the measured headphones have also been listened to. Therefore, in Kuulokenurkka, we find it important to write down our observations instead of only publishing frequency response measurements to describe the sound of headphones.
The impact of how results are presented on interpretation
Like all other graphs containing X and Y axes, the frequency response of headphones can be presented in many different ways, for example, by using the settings of the REW software. I would like to conclude by presenting a few visual manipulation methods for measurement results, which could be used to overemphasize or downplay, for example, the magnitude of individual boosts and dips in the frequency response or the differences between different headphone models. In principle, it would be possible to make the frequency response of every headphone model look better than it actually is, but this would still be quite easily caught, as frequency response measurements of the same headphones published by others are often found online.
Graph scale:
When examining a frequency response created with REW software, it is always advisable to check the scales of the graph's X and Y axes, as they significantly affect the visual appearance of the result. EARS can measure frequencies between 20–20,000 Hz, so the frequency response curve most often represents this frequency range. For example, in Roderick's measurements, this frequency range is shown on the X-axis, but I cut the graph at 17,000 Hz to make it slightly narrower horizontally. Presenting the very highest frequencies is fully justified, but their accuracy begins to be on quite uncertain ground, so they do not have significant informational value (unless a headphone model is completely incapable of reproducing those frequencies).
More important for interpretation is the Y-axis scale. If the frequency response curve is aligned at 300 Hz to, for example, 80 decibels, and the Y-axis scale is chosen as 0–160 decibels, the frequency response becomes very flat, and it is impossible to distinguish variations of a few decibels. Conversely, by limiting the Y-axis scale to between 70–90 decibels, smaller variations appear remarkably large, which can create a negative impression even of a headphone model that measures excellently flat.

I personally limit the Y-axis scale to between 55–100 decibels (REW's default would be 50–100), as I believe it's a good compromise that highlights the characteristics of the frequency response without overemphasizing ”errors.” In this case, for example, 2–3 decibel changes are clearly visible in the graph, even if they are not very obvious when listening to headphones. Usually, only a 5-decibel variation starts to be heard more clearly in the sound, so when reading a frequency response, it's always worth checking from the left edge of the graph how many decibels a given boost or cut actually represents.
Smoothing value:
When publishing frequency responses, it would always be good to mention the smoothing value used, as it allows for rounding off the sharpest peaks and dips in the frequency response. Without smoothing, the frequency response usually has much smaller ripples and MiniDSP EARS's own inaccuracies, so rounding the results is justified and recommended. However, excessive smoothing removes existing information from the frequency response, making the graph appear flatter and ”better” than reality. Larger smoothing values than the recommended 1/12 octave smoothing method (e.g., 1/6 or 1/2) are sometimes useful when demonstrating differences between various headphone models, but over-smoothing problem areas of the frequency response could also create an overly positive impression of a particular headphone model.

Presenting differences between headphones:
Finally, I want to discuss comparing the frequency responses of multiple headphone models in the same graph. We measure all headphones by first adjusting them to play a test tone in REW at 84 decibels at a frequency of 300 Hz. For this reason, all measured frequency responses intersect each other at 300 Hz by default. However, frequency responses can also be shifted and aligned to another frequency.
The default 300 Hz alignment is a good starting point if the headphones being compared reproduce bass and lower mid-frequencies equally loudly. However, if, for example, in a pair comparison, one headphone has significantly more lower frequencies quantitatively, aligning at 300 Hz gives a misleading picture of other frequency ranges. The low frequencies of headphones may appear identical when comparing frequency responses, even though in reality, when listening to the headphones, they have the biggest difference. At the same time, the mid-frequencies may visually appear to have a night-and-day difference, even if the actual difference is considerably smaller.
The following image illustrates the situation I described above using Sennheiser HD600 and Anker Q30 headphones. The Anker model actually has significantly more bass, and certainly not significantly less mid-frequencies and treble. The frequency response of both models is indeed presented completely correctly, but comparing the models is difficult.

A more truthful and easily interpretable comparison of these headphone models can be obtained by aligning the frequency responses to a different frequency. The choice of this frequency always requires a subjective decision based on listening to the headphones. I always try to best highlight how the headphones I am comparing sound relative to each other. In addition to 300 Hz, I use other frequencies between 200–1000 Hz for alignment, depending on what works best in each comparison situation. Many other reviewers do the same, so when examining graphs, it's worth noting the frequency range to which the compared frequency responses have been aligned.

Final remarks
Despite its shortcomings, MiniDSP EARS has proven to be a useful tool for evaluating headphone sound quality, equalizing headphones, and experimenting with different ear pads. The device makes it possible to learn more about why certain headphones sound the way they do. However, EARS still does not replace listening to headphones; the measured frequency response should only be considered as indicative information.
Measuring headphones before listening to them can even be misleading, as one expects the sound to more clearly match the measured frequency response. If this is not the case, a conflict easily arises in the mind, which can be difficult to let go of. For this reason, we usually perform frequency response measurements only after we have thoroughly familiarized ourselves with the headphones by listening to them first.
In this article, I only covered frequency response measurements made with EARS, but it would also be possible to perform, for example, distortion measurements and waterfall measurements with the device. However, these measurement results are generally not of great practical benefit in assessing the sound quality of headphones, and they are also more difficult to interpret. For this reason, publishing them without a reasonable interpretation does not seem like a sensible activity to us. For now, we will focus only on frequency response measurements.
It would be nice for me to own a proper professional-grade measurement device someday, but acquiring one would require a significant financial investment. Purchasing an expensive device would probably not be sensible purely on a hobby basis, so it will remain a dream at this stage. The affordable MiniDSP EARS might seem like just a toy compared to better devices, but it is also very useful, as long as too much is not expected from it.