Headphone frequency responses measured in Headphone Corner using equipment compliant with the IEC-60318-4 (IEC711) standard can be viewed and compared on the Squiglink website. In the spirit of open data collection, the site also features many measurements made by other people. When visiting different Squiglink pages, it's important to remember that each person performing measurements may be using slightly different equipment, meaning the results are not fully comparable with each other.
Frequency Response Comparison Tool →
The frequency response database also contains headphones which we haven't reviewed (at least not yet) or which have only been listened to briefly. Measurements for these headphone models have been taken, for example, in various hi-fi stores, such as the local Kuva ja Ääni in Joensuu Finland.
Instructions for using Squiglink and interpreting frequency responses
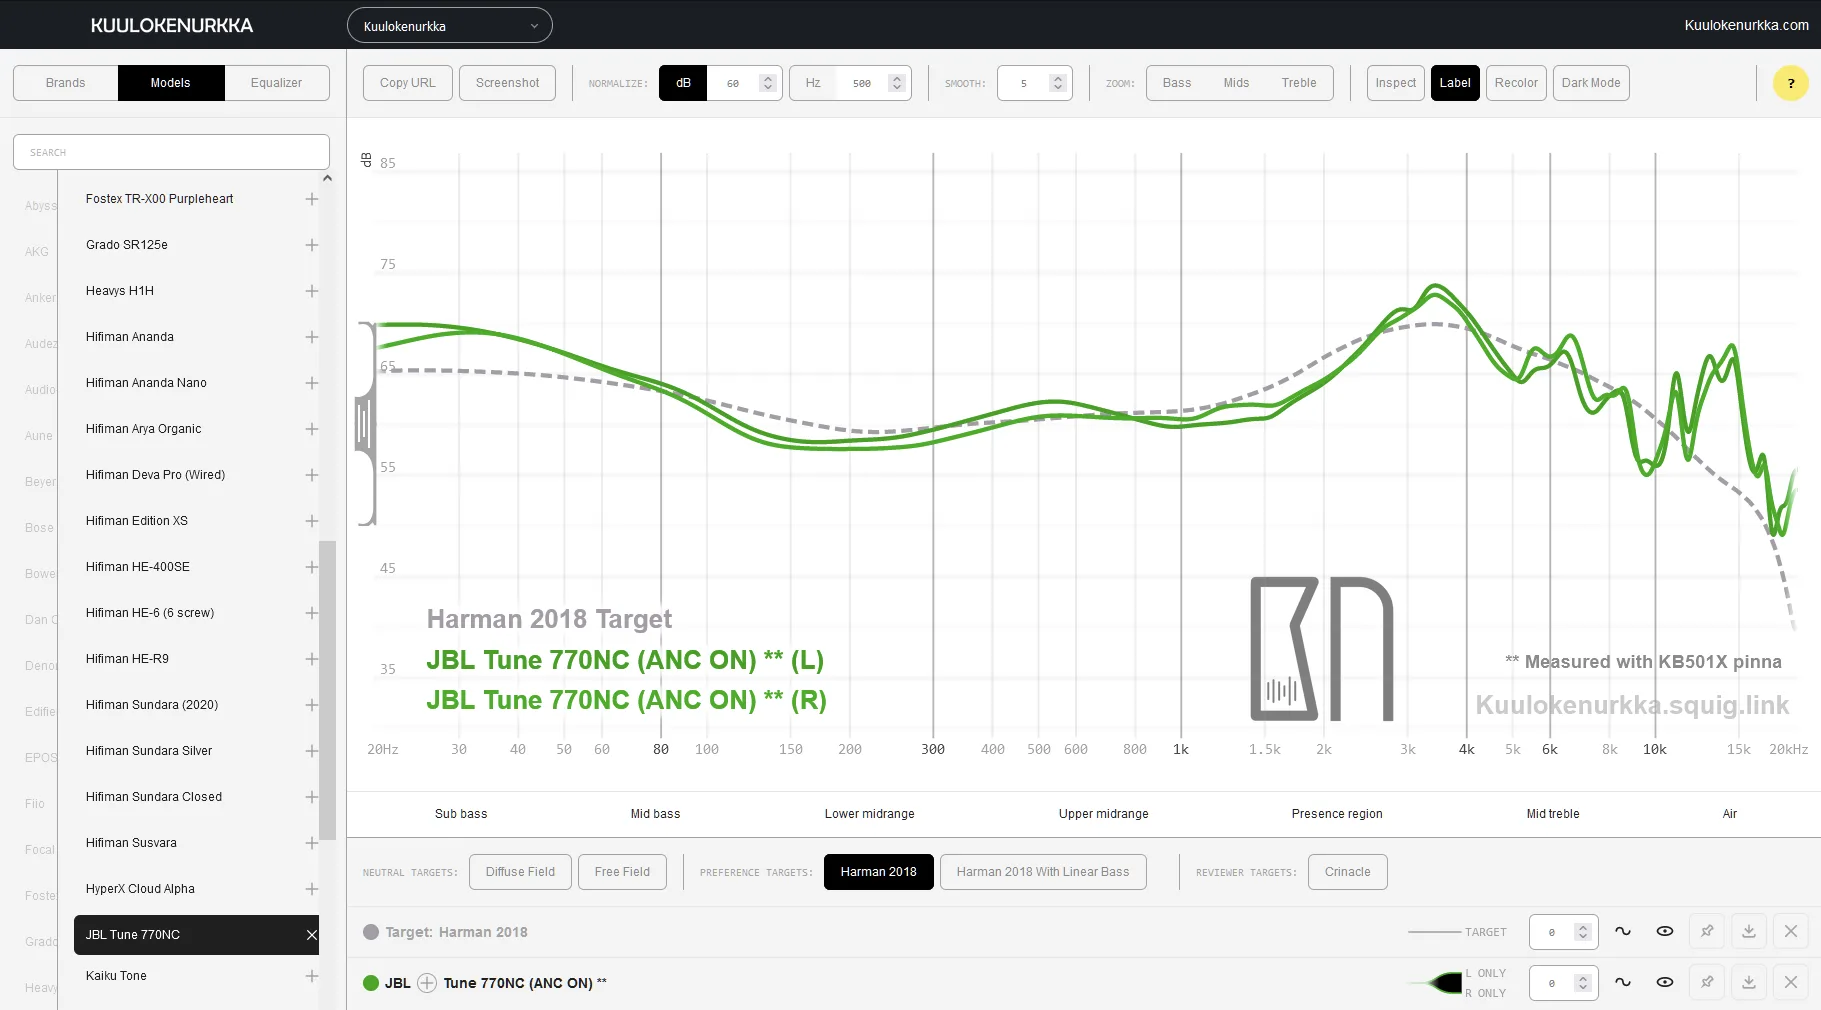
For each measured headphone, both the right and left channel responses are available separately. These can be combined into an average by clicking the narrow tail of the icon located in the graph list. If multiple headphone models are added to the comparison simultaneously, the average of the two channels is automatically displayed for each headphone.

The left and right channel in many headphones differs slightly from each other, and some models are challenging to measure identically. Because there is also slight unit variation, the frequency response and channel balance should be taken as one observation. If the manufacturer's quality control is solid, the measurements represent the specific headphone model well. Conversely, in extreme cases, some other unit might have measured quite differently. On the other hand, many other factors, such as the wear level of the earpads, also have their effect on the results.
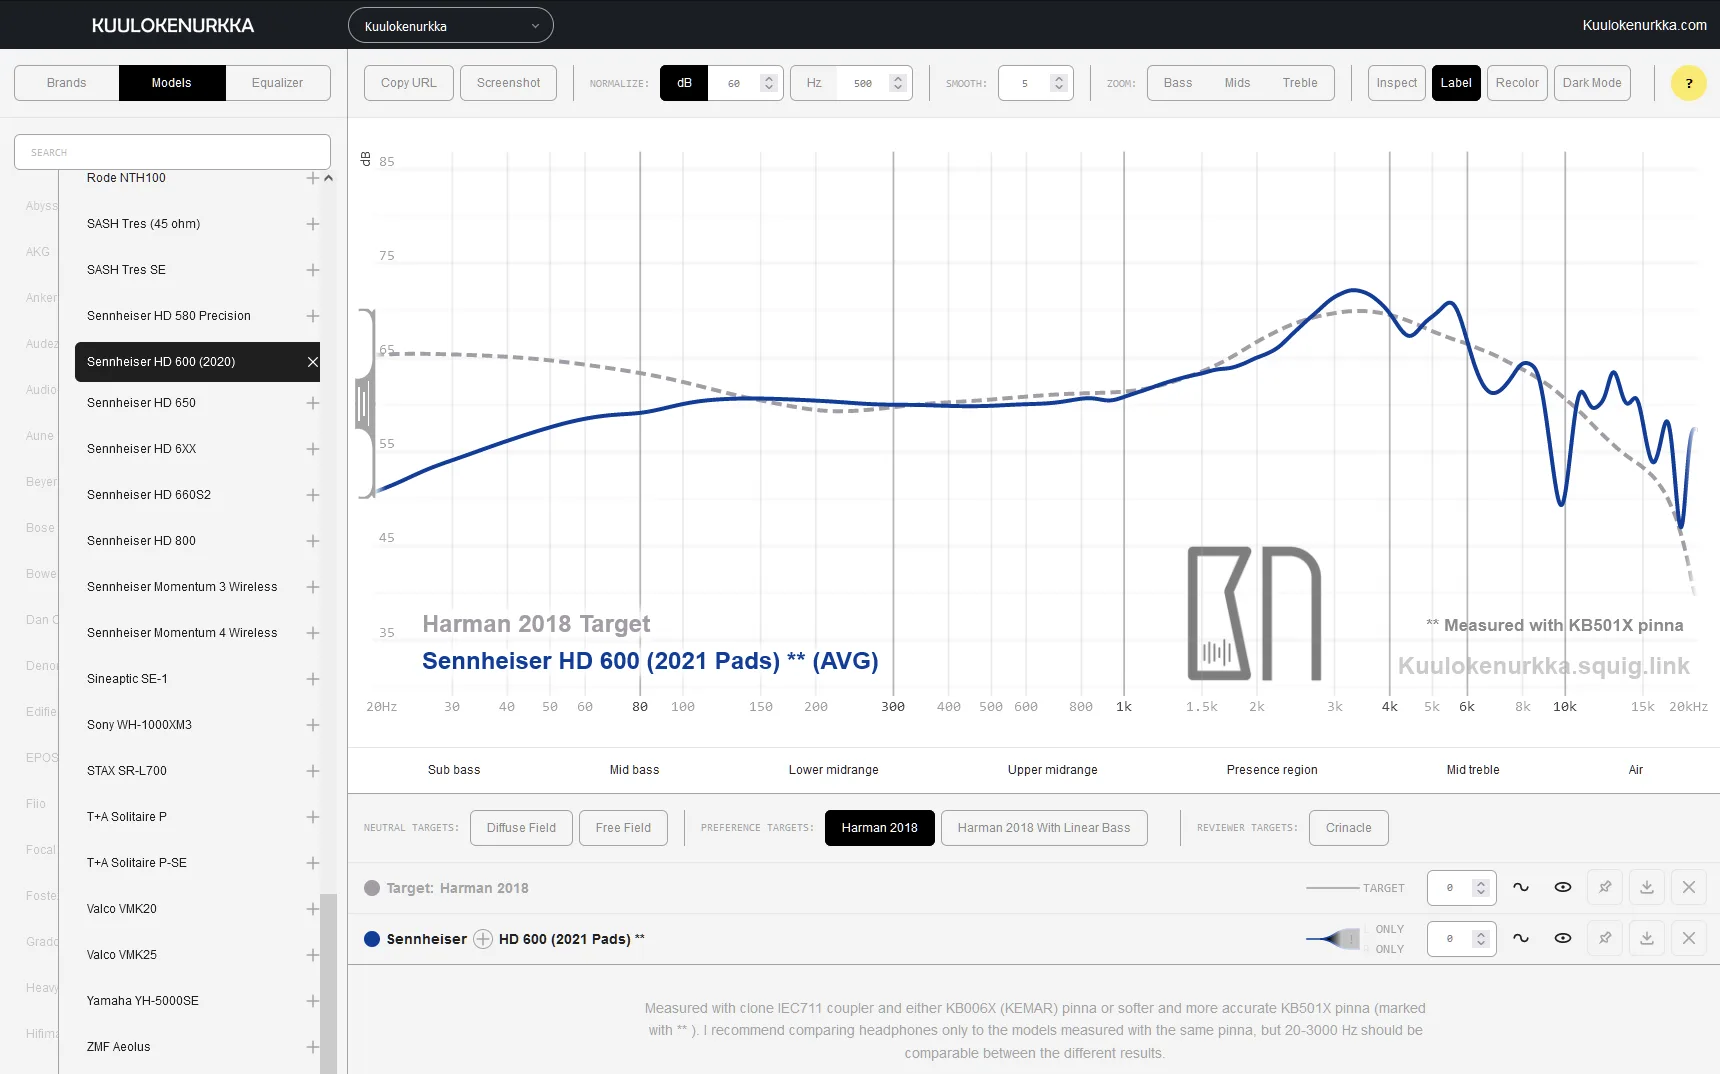
By default, the Squiglink (and our current reviews) present raw measurements, where the optimal headphone response is not a straight line. This is because headphones are measured from inside the ear, not in a room like loudspeakers. Taking into account the effect of the pinna, higher frequencies should measure stronger than lower frequencies (this is called the ear gain region). Our ears naturally amplify these frequencies, and our brains expect to hear them this way – research shows that the sound then appears normal to us. Based on this, various target responses/curves have been created to aid in the interpretation of headphone frequency responses and to serve as a baseline for comparison. The most commonly used of these is the Harman Target Curve (more on this a bit later). The frequency response comparison tool also allows you to use other target curves if they reflect your own preferences better than Harman curve.
The graphs can also be displayed as compensated by clicking the button located next to the selected target curve (e.g., Harman Target 2018). In this case, the target curve becomes a horizontal reference, and the graph itself shows by how many decibels the headphone response deviates from it at any given frequency. This information can be helpful, for example, when equalizing headphones. On the other hand, a frequency response displayed as a straight line can also simply be easier to interpret compared to the raw measurement shown by default. However, when interpreting the graphs, it's always important to be careful whether you are looking at a raw information or a compensated result. Most websites present their results as raw measurements because these directly reveal the shape of the target curve. Compensated results lacking additional information can easily lead to misinterpretations, as they might be based on a less common target curve.
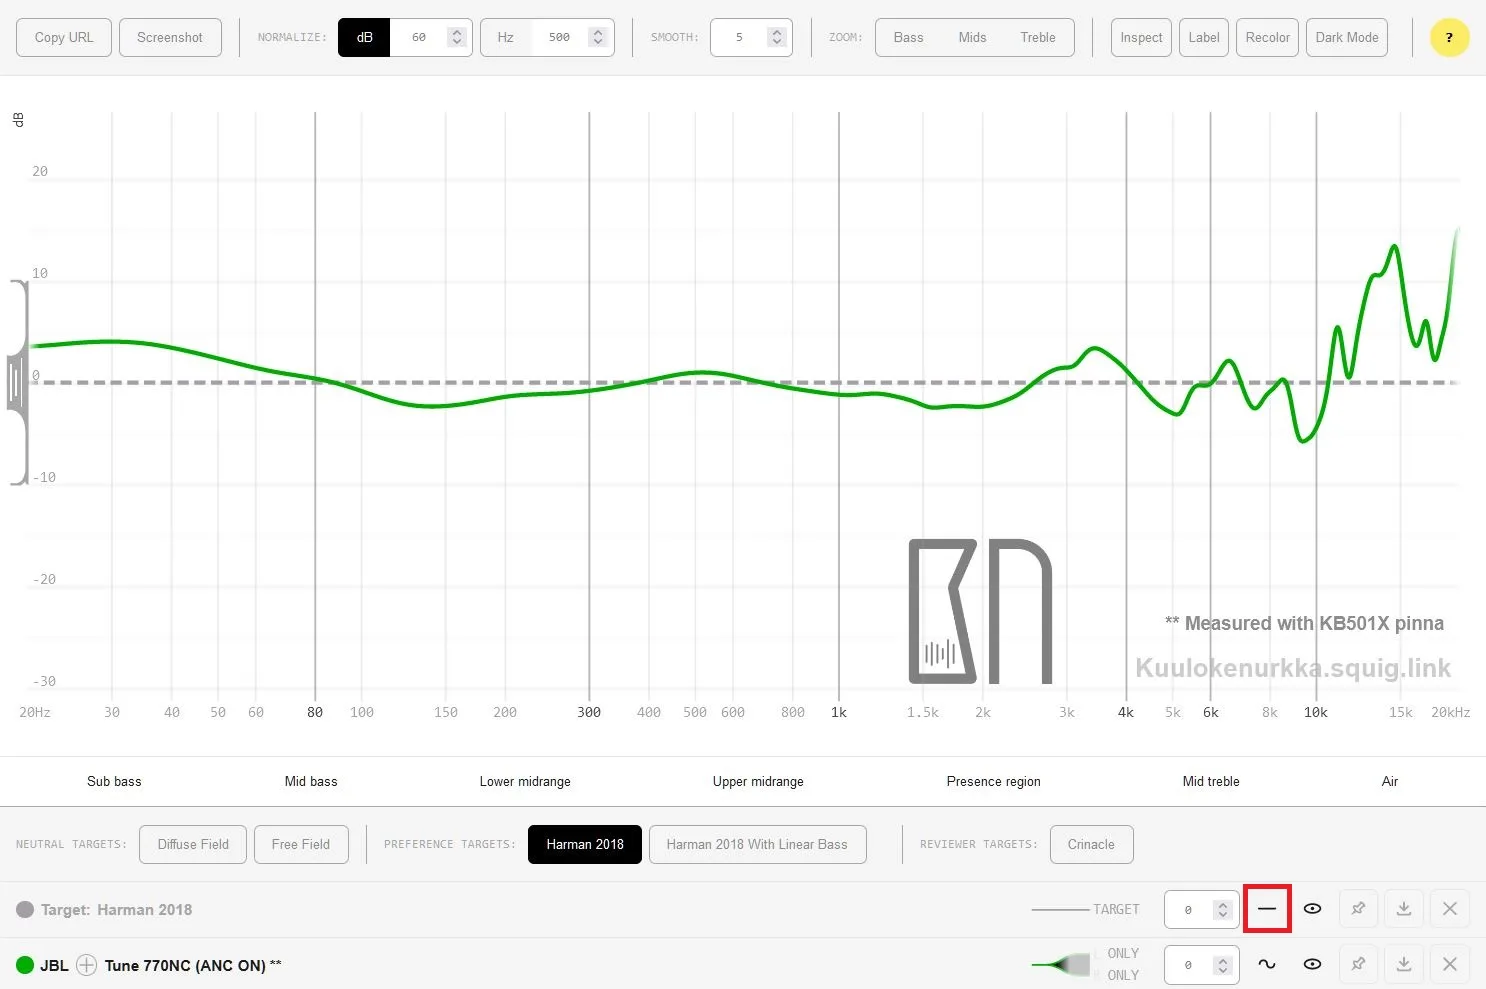
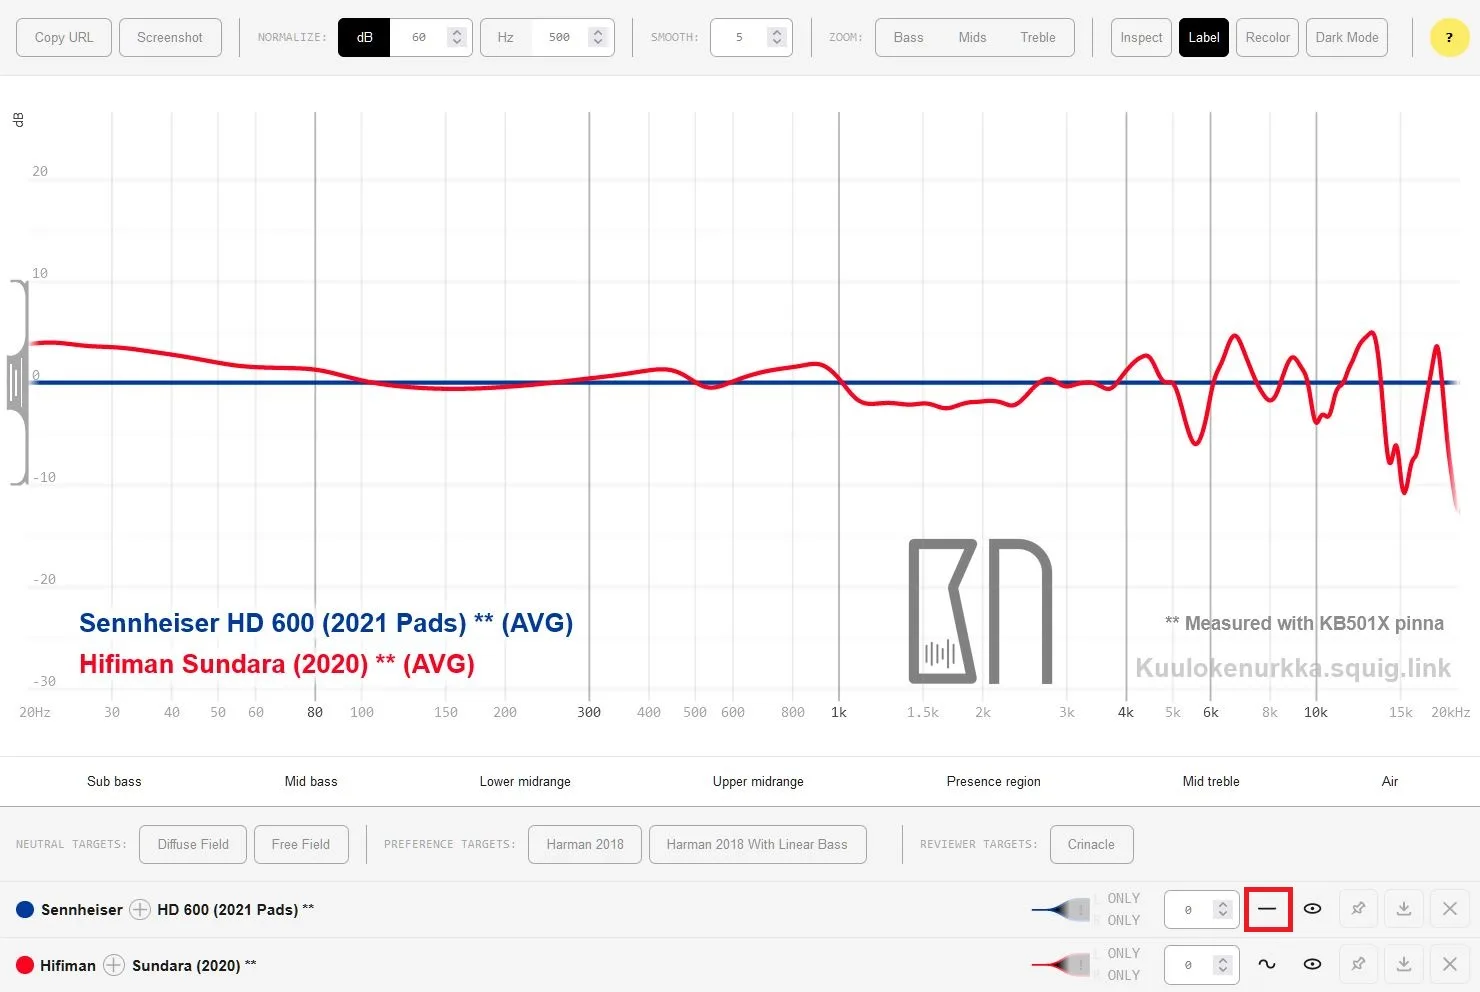
The same compensation function can also be used for comparing two different headphone models, using one as a reference for the other:
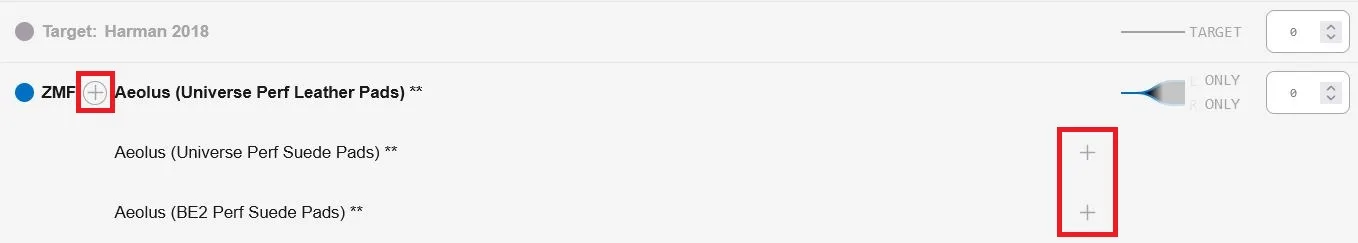
The color of the lines shown in the graph can be changed by clicking the colored circle to the left of each headphone model's name. Some headphones, for example, have been measured with different earpads, meaning several different results may be available for them. You can access these via the plus button located between the manufacturer's name and the headphone model. Multiple graphs can be added to the view simultaneously by clicking the plus buttons located on the right side.
Squiglink Equalizer
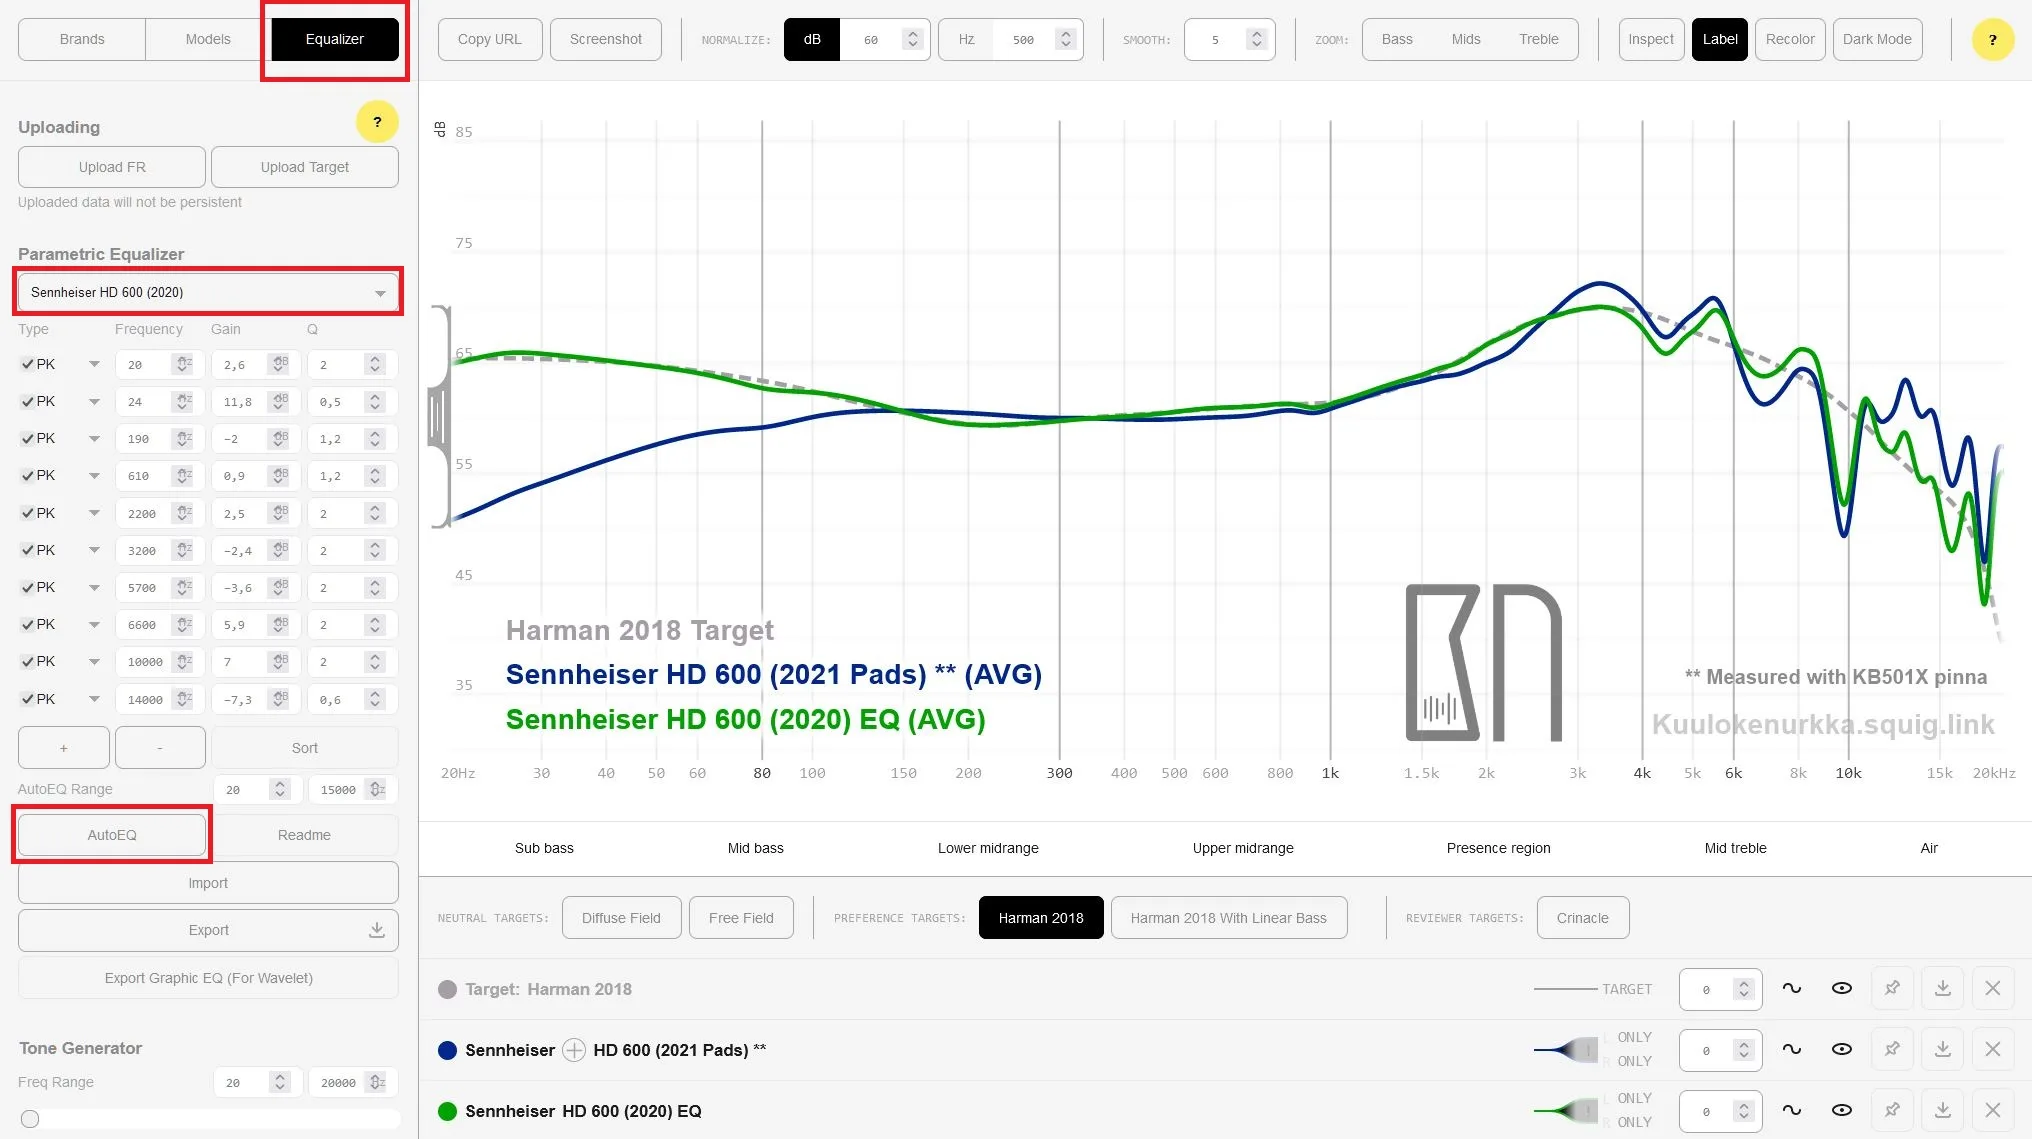
Squiglink is also useful thanks to its built-in equalizer. Once you have selected the desired target response and the available measurements for your headphone model, the AutoEQ button generates suitable settings for equalization in a few seconds. These settings could then be added, for example, in the Equalizer APO or in some other parametric EQ software. In addition to automatic equalization, manual adjustments are also possible, allowing you to observe the FR change in real time.
Often, automatically generated equalization still requires fine-tuning by ear. Particularly, for high frequencies, it's never advisable to make steep changes based solely on measurement data; instead, rely more on your own hearing. This is because the accuracy of measurement equipment is quite limited between 5–20 kHz, meaning that the underlying data used in automatic correction could, unfortunately, be inaccurate compared to how a human actually perceives the sound. In some cases the automatic equalization can be quite accurate, while other times treble might get too boosted, even if its level may look suitable on paper. Furthermore, human hearing differs the most in the high frequencies, meaning no form of automation can ever make headphones universally suitable. For this reason, there's no need to be alarmed if the equalization doesn't sound good immediately – it just needs to be fitted to your own hearing. Similarly, if EQ profiles aiming for the Harman target curve that you have tried before have sounded poor, the reason might lie in the inaccuracy of the FR measurements used as baseline.
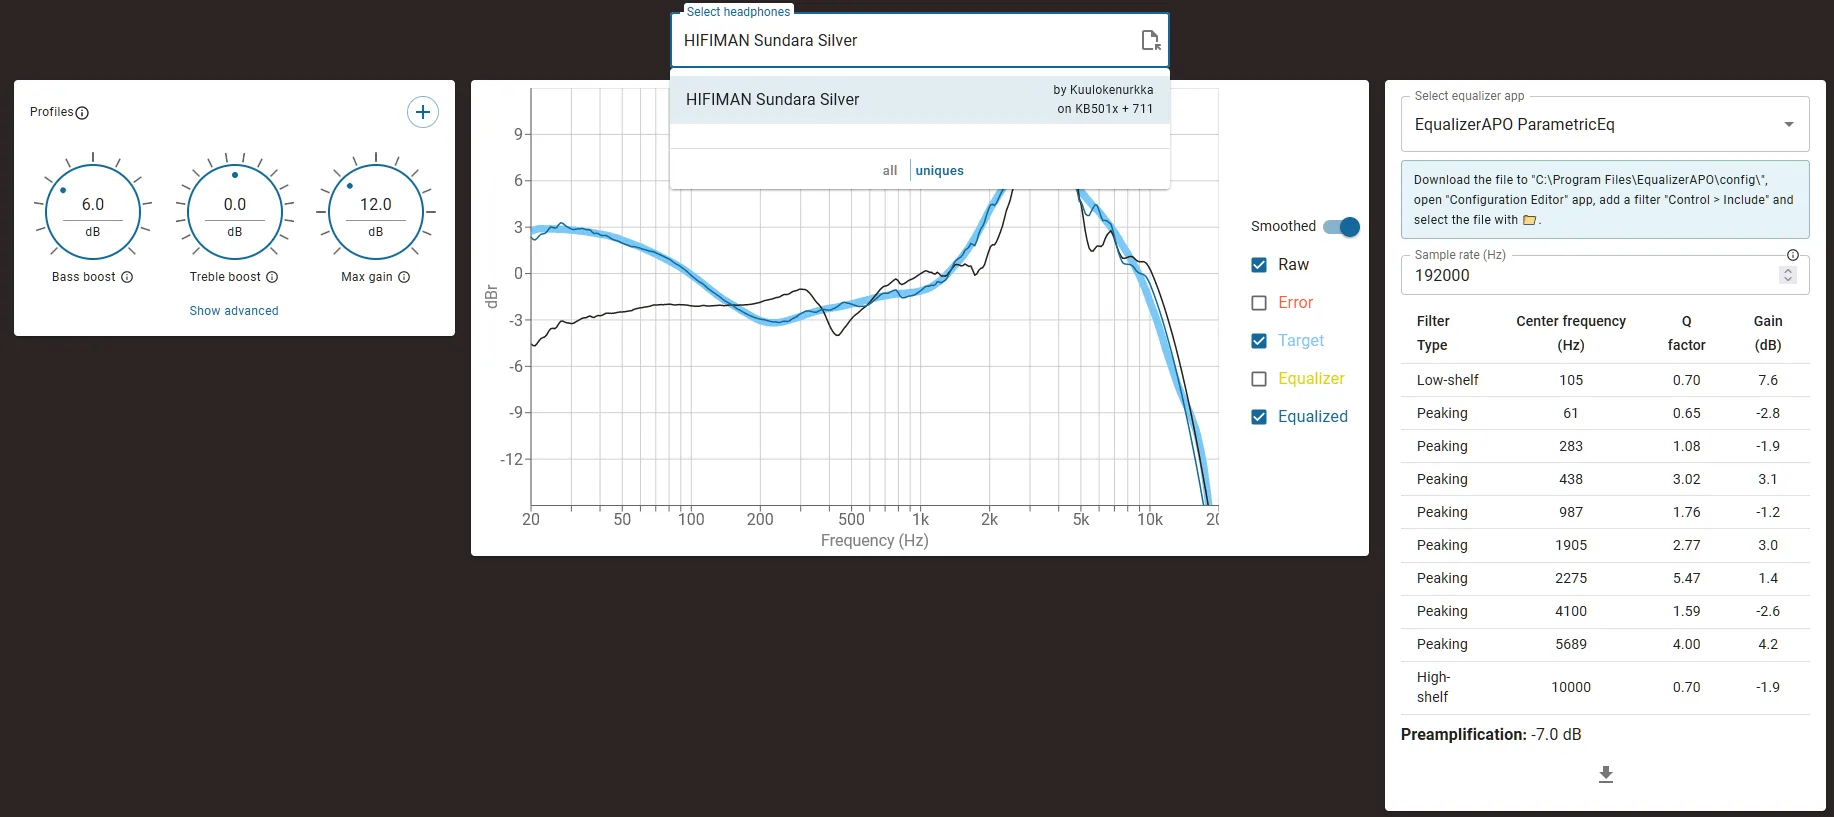
In addition to the Squiglink, automatic equalization can also be done using the AutoEQ-tooldeveloped by Finnish Jaakko Pasanen. I would call it slightly more versatile and sophisticated in its functions. Currently, the AutoEQ tool also includes frequency response measurements performed by Headphone Corner. If the data for a specific headphone model added to the Squiglink website cannot be found directly using AutoEQ's search function, the measurements can also be saved as a text file through Squiglink and then imported into AutoEQ manually. In the past, such easy equalization could only be dreamt of.
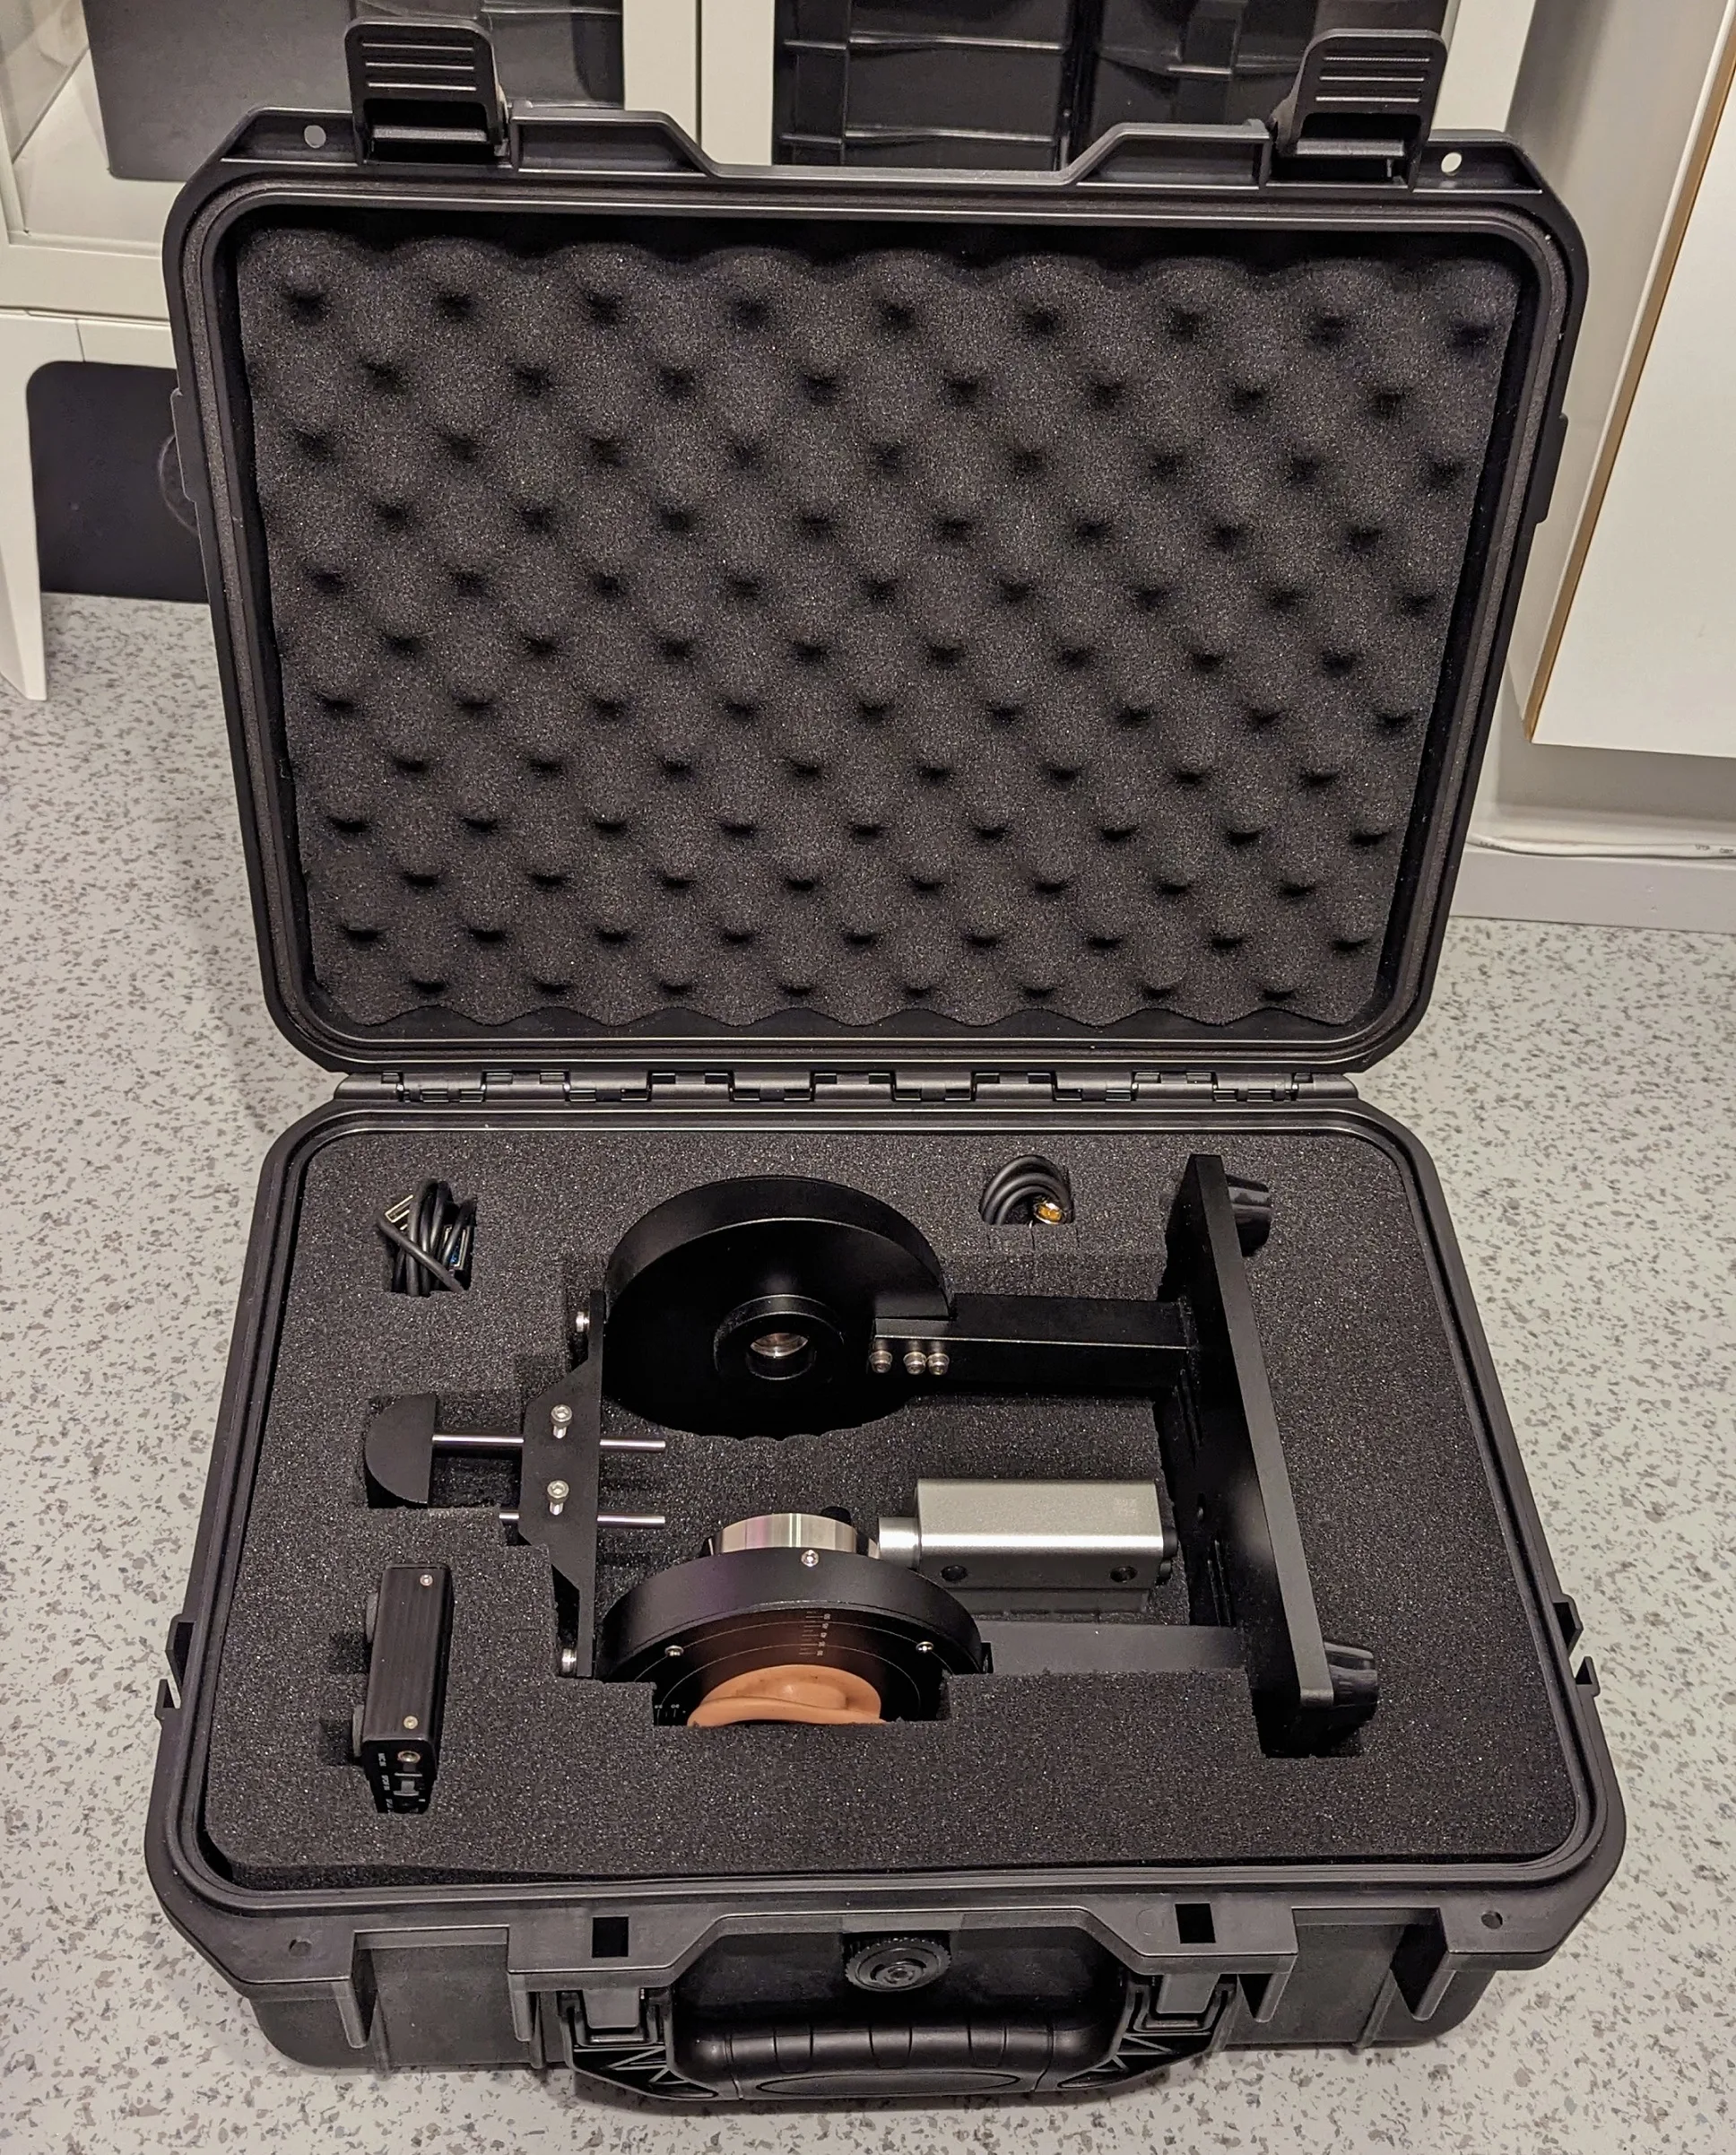
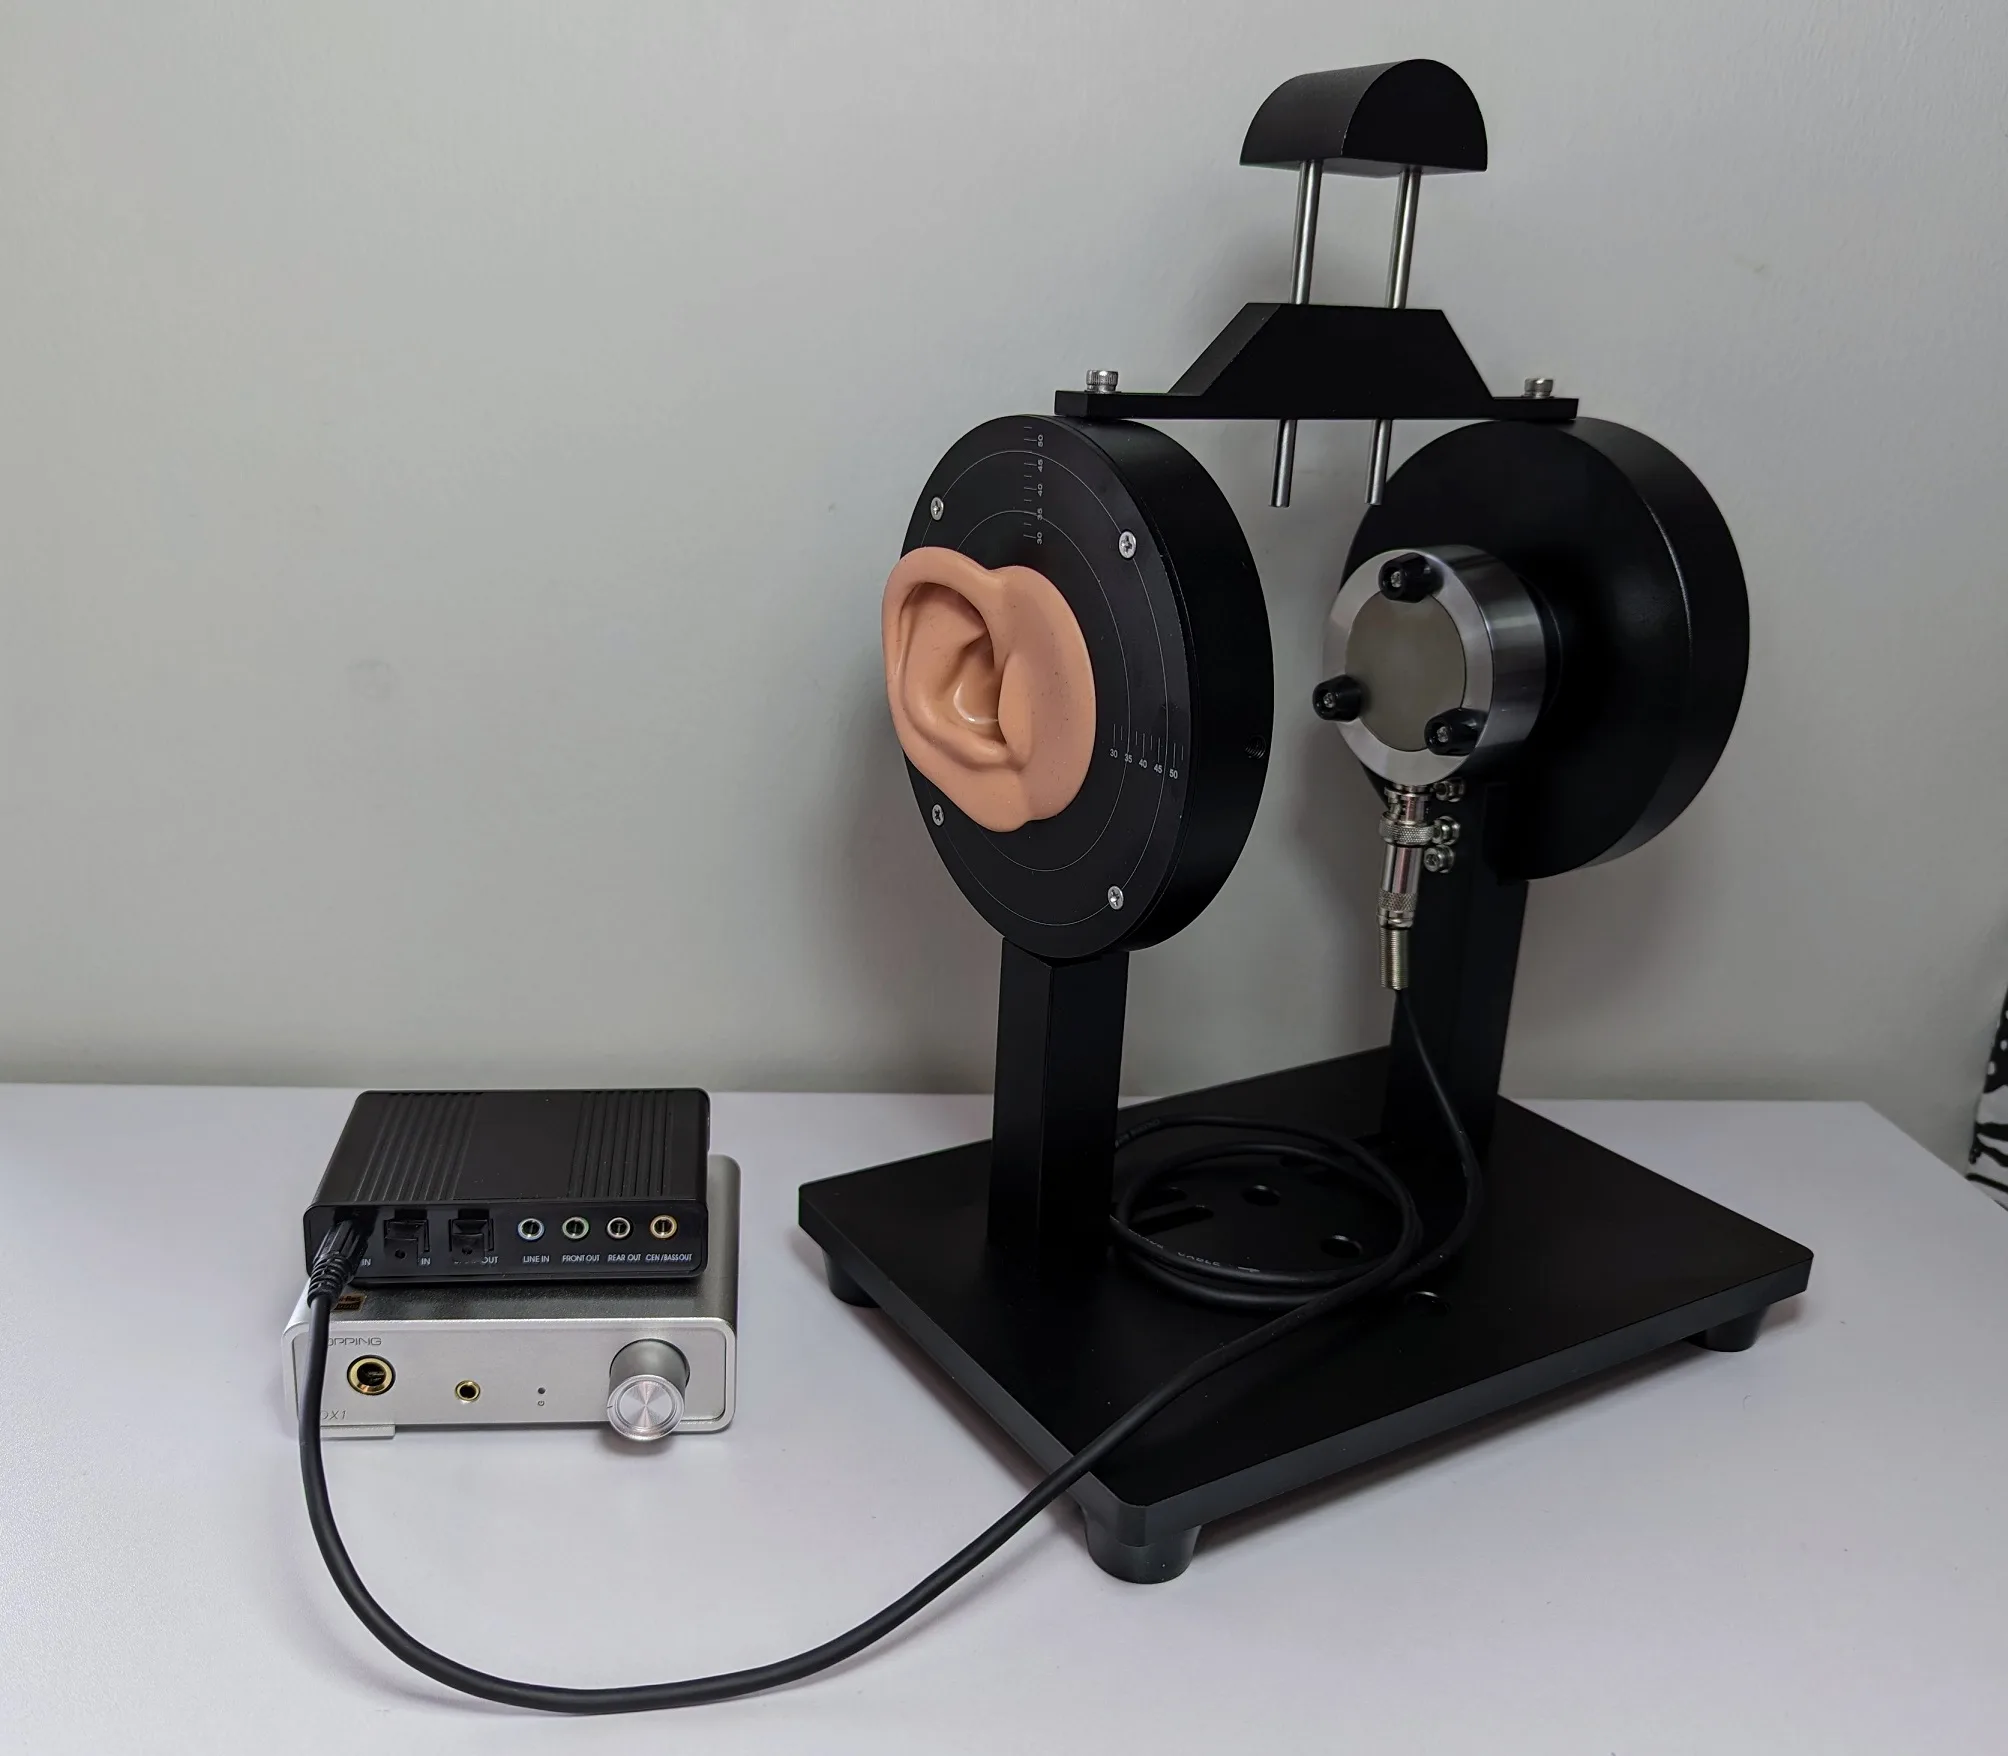
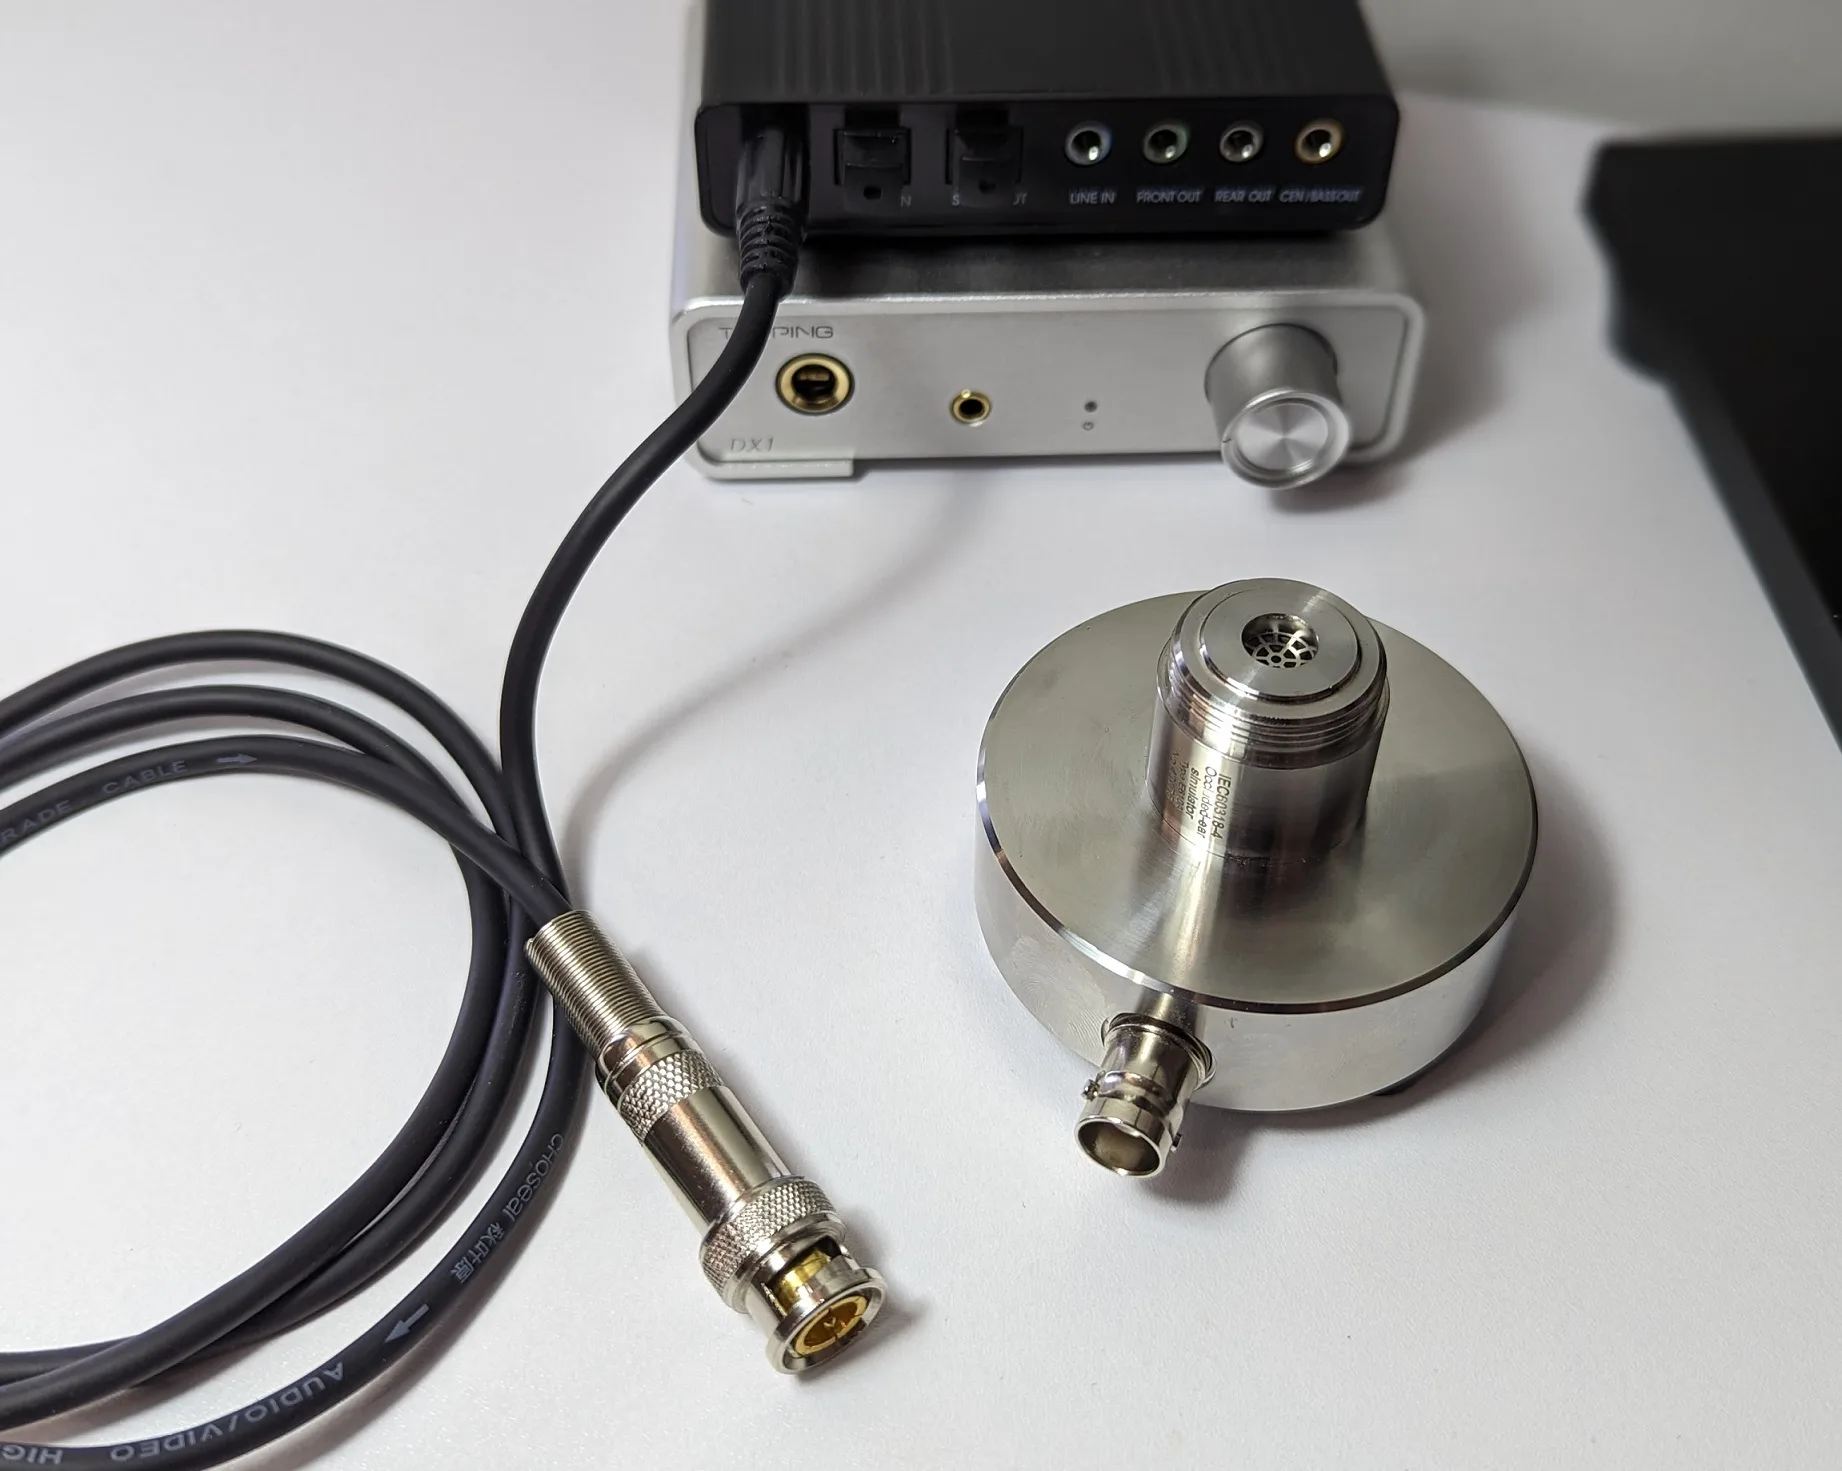
The measuring rig
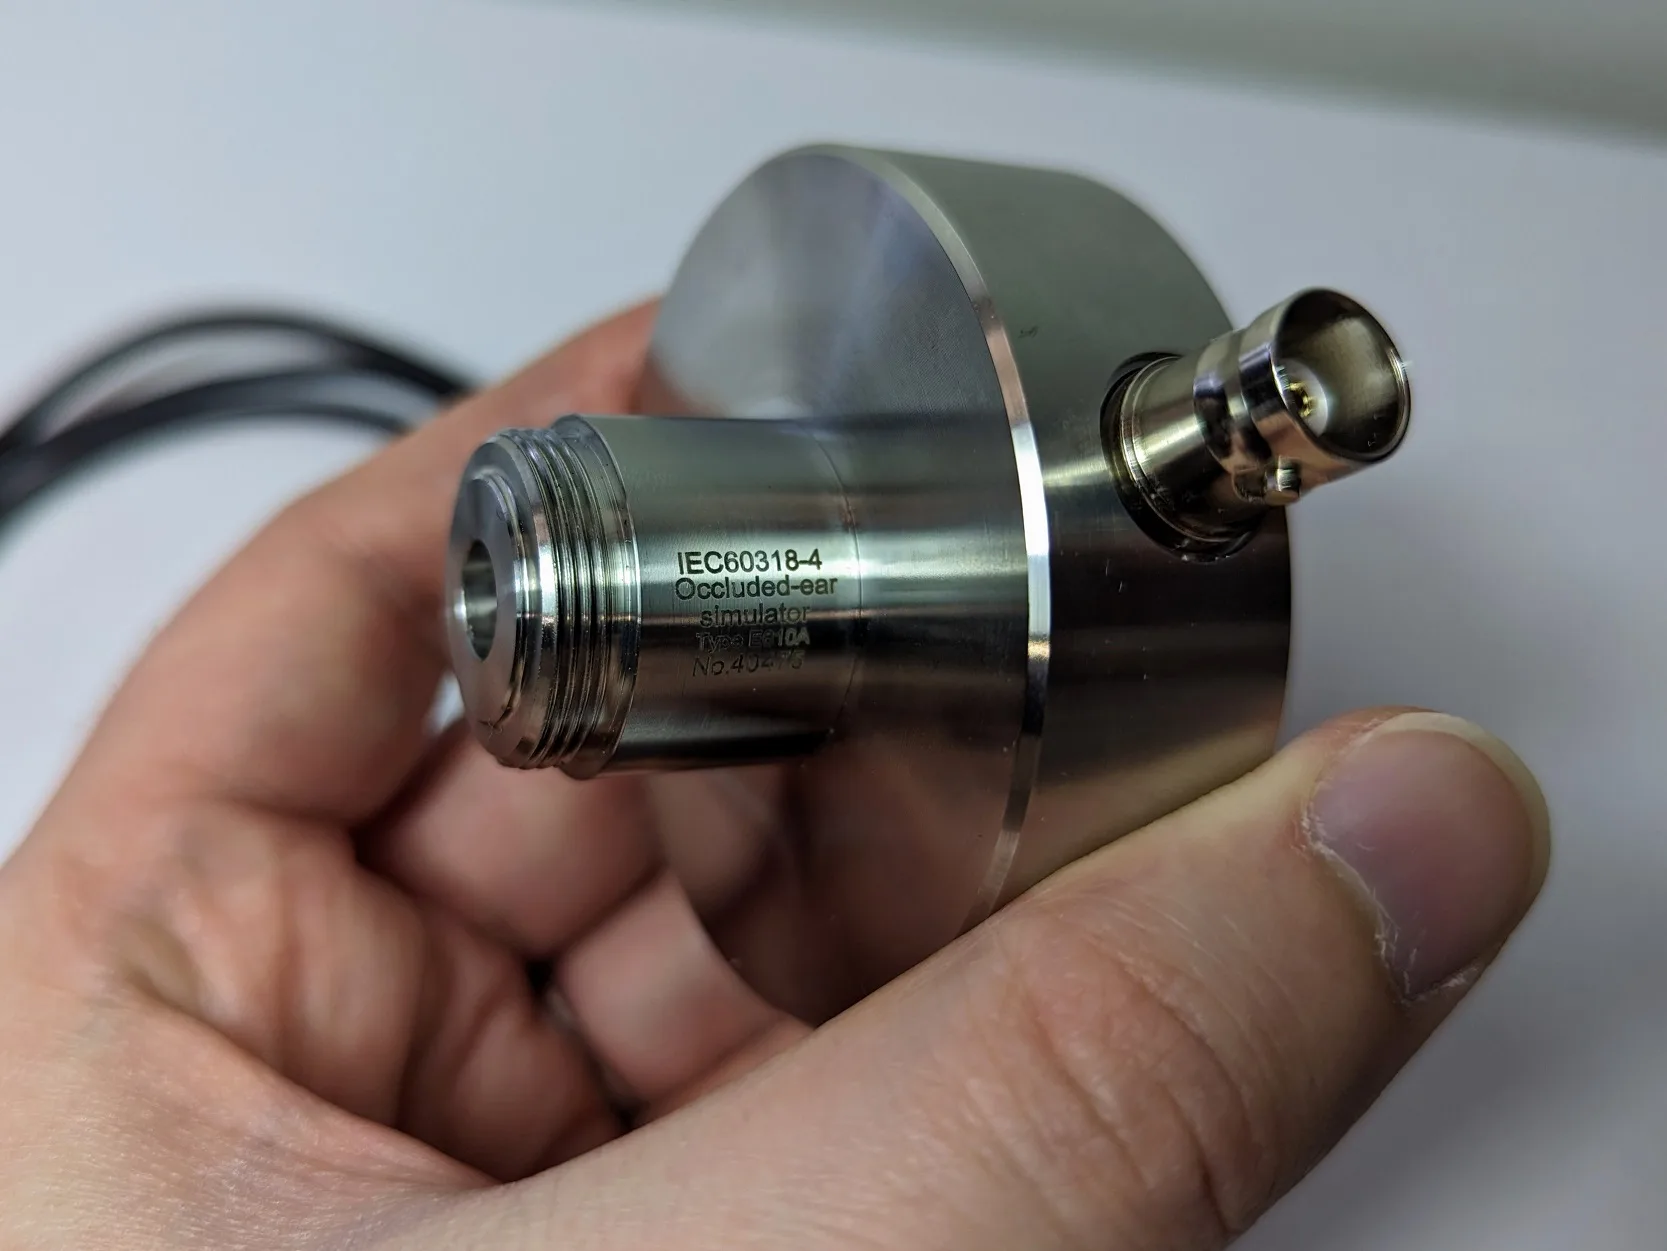
Frequency responses are measured with equipment compliant with the IEC-60318-4 (IEC711) standard, which consists of a coupler imitating the human inner ear (also includes a microphone) and silicone ear replicas/outer ears (pinna). These parts are relatively affordable Chinese equivalents to GRAS equipment (e.g., model 43AG), which costs between 7 000-20 000 euros. Headphone Corner currently cannot afford this. On the other hand, acquiring genuine GRAS equipment is also not very justified nowadays, as more modern Brüel & Kjaer (B&K) devices (users include, among others, Headphone Show and Linus Tech Tips) are rapidly becoming more common due to their even better accuracy. Unfortunately, the prices of these better devices are around 50,000 euros, so only a few can afford them. Let's therefore stick with this type of equipment:
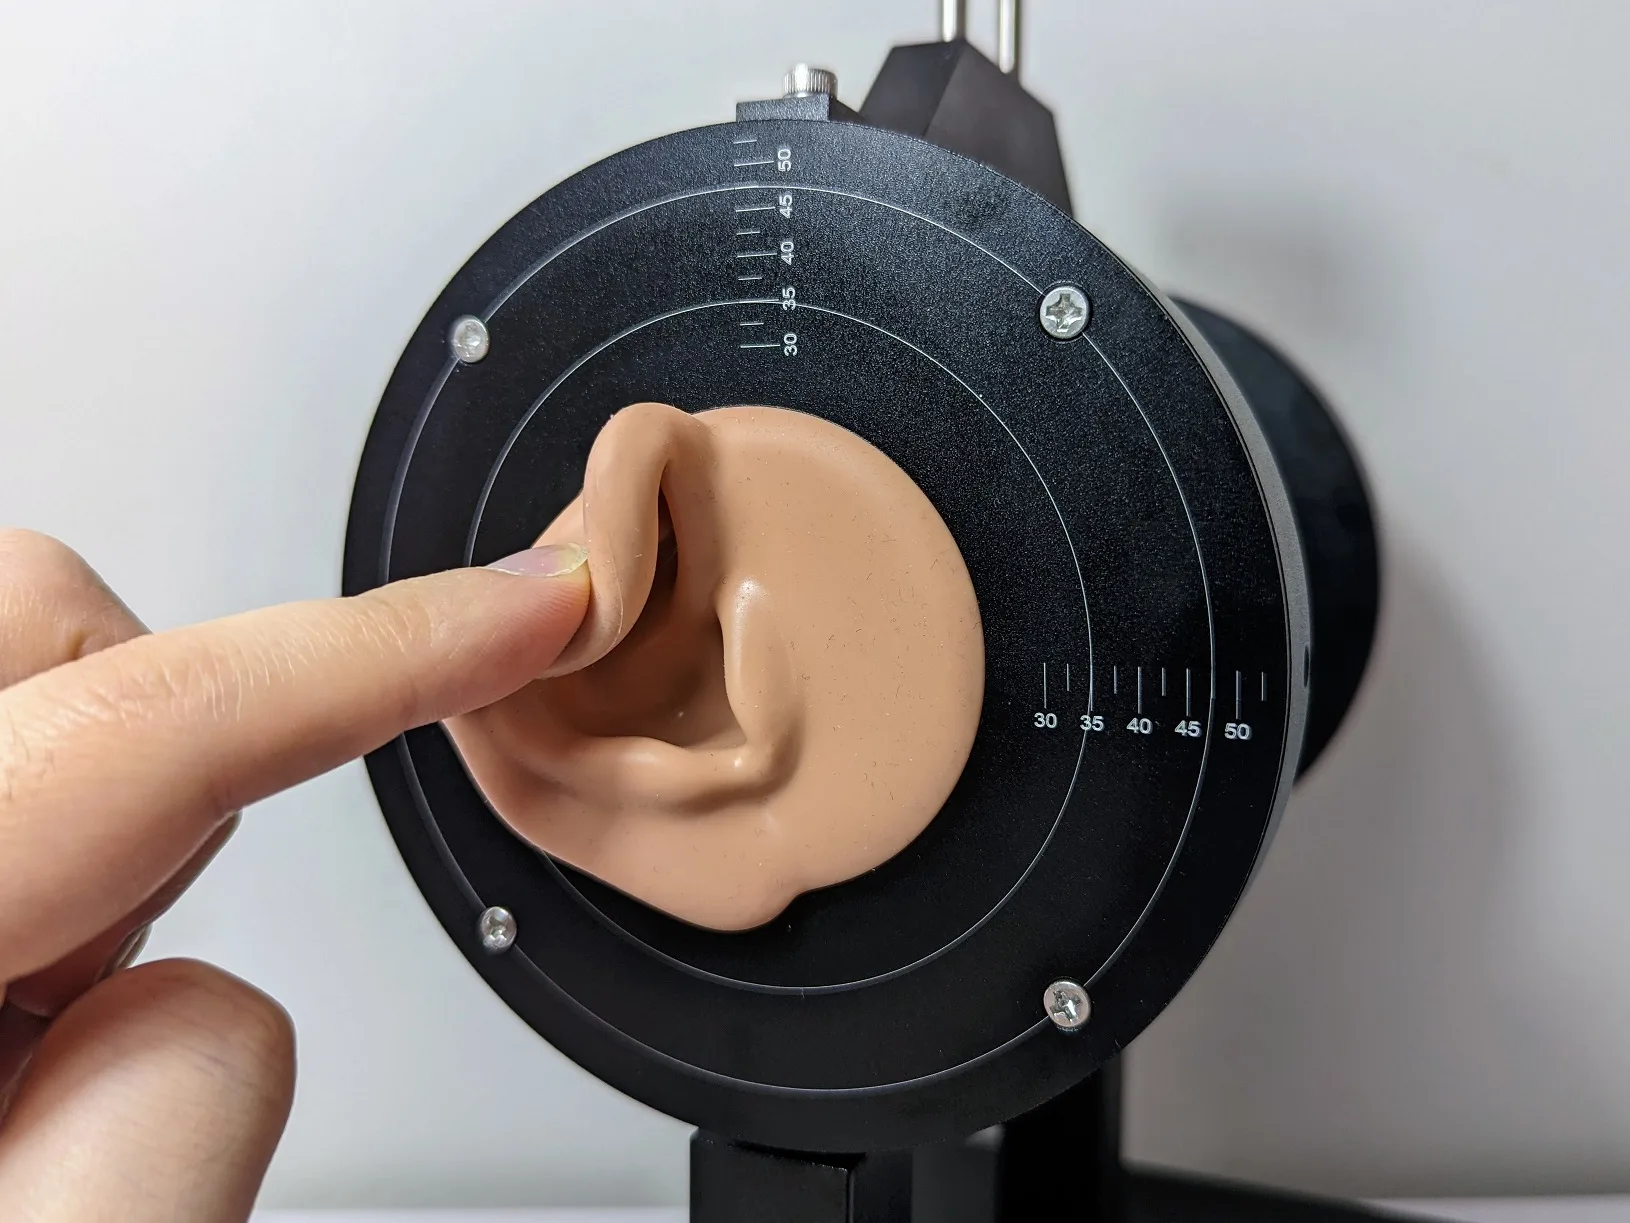
The biggest physical differences of the Chinese clone rig compared to the GRAS configuration are the outer ears made from slightly stiffer silicone and a slightly longer ear canal length. There is also a difference in the accuracy of the microphone, and the more expensive devices are generally calibrated to match each other, whereas the Chinese equivalents are not completely identical.
Earlier, I used the stiffer KB006X pinna which did not provide the best fitting, especially for on-ear models or noise-cancelling headphones equipped with small earpads. This pinna also had a partially metallic ear canal, whose resonances could incorrectly boost certain high frequencies. Nevertheless, the measurement accuracy with KB006X pinna was still quite good, so the measurements found in the database are generally ok considering the variation between headphone units and different measurement conditions (e.g., different clamping force and headphone placement on the device).
Since April 2023, I have been using significantly softer and more accurate KB501X standard pinna. Measurements made with them are marked with two asterisks ** in the Squiglink database. With the better ears, measuring both over-ear and on-ear headphones is easier. Furthermore, the ear canals are made entirely of silicone, resulting in fewer errors and resonances at high frequencies. The upper midrange is also measured more comparably to genuine GRAS equipment, although achieving an identical end result is still not possible, of course.
More accurate equipment costs many times more for a reason, and two different devices never yield completely identical results. Therefore, the measured frequency response should be understood as describing the performance of the headphones under specific conditions, i.e., with a certain type of measuring rig in this case. If the same headphones are measured with different equipment, the conditions and consequently the frequency response will also change slightly.
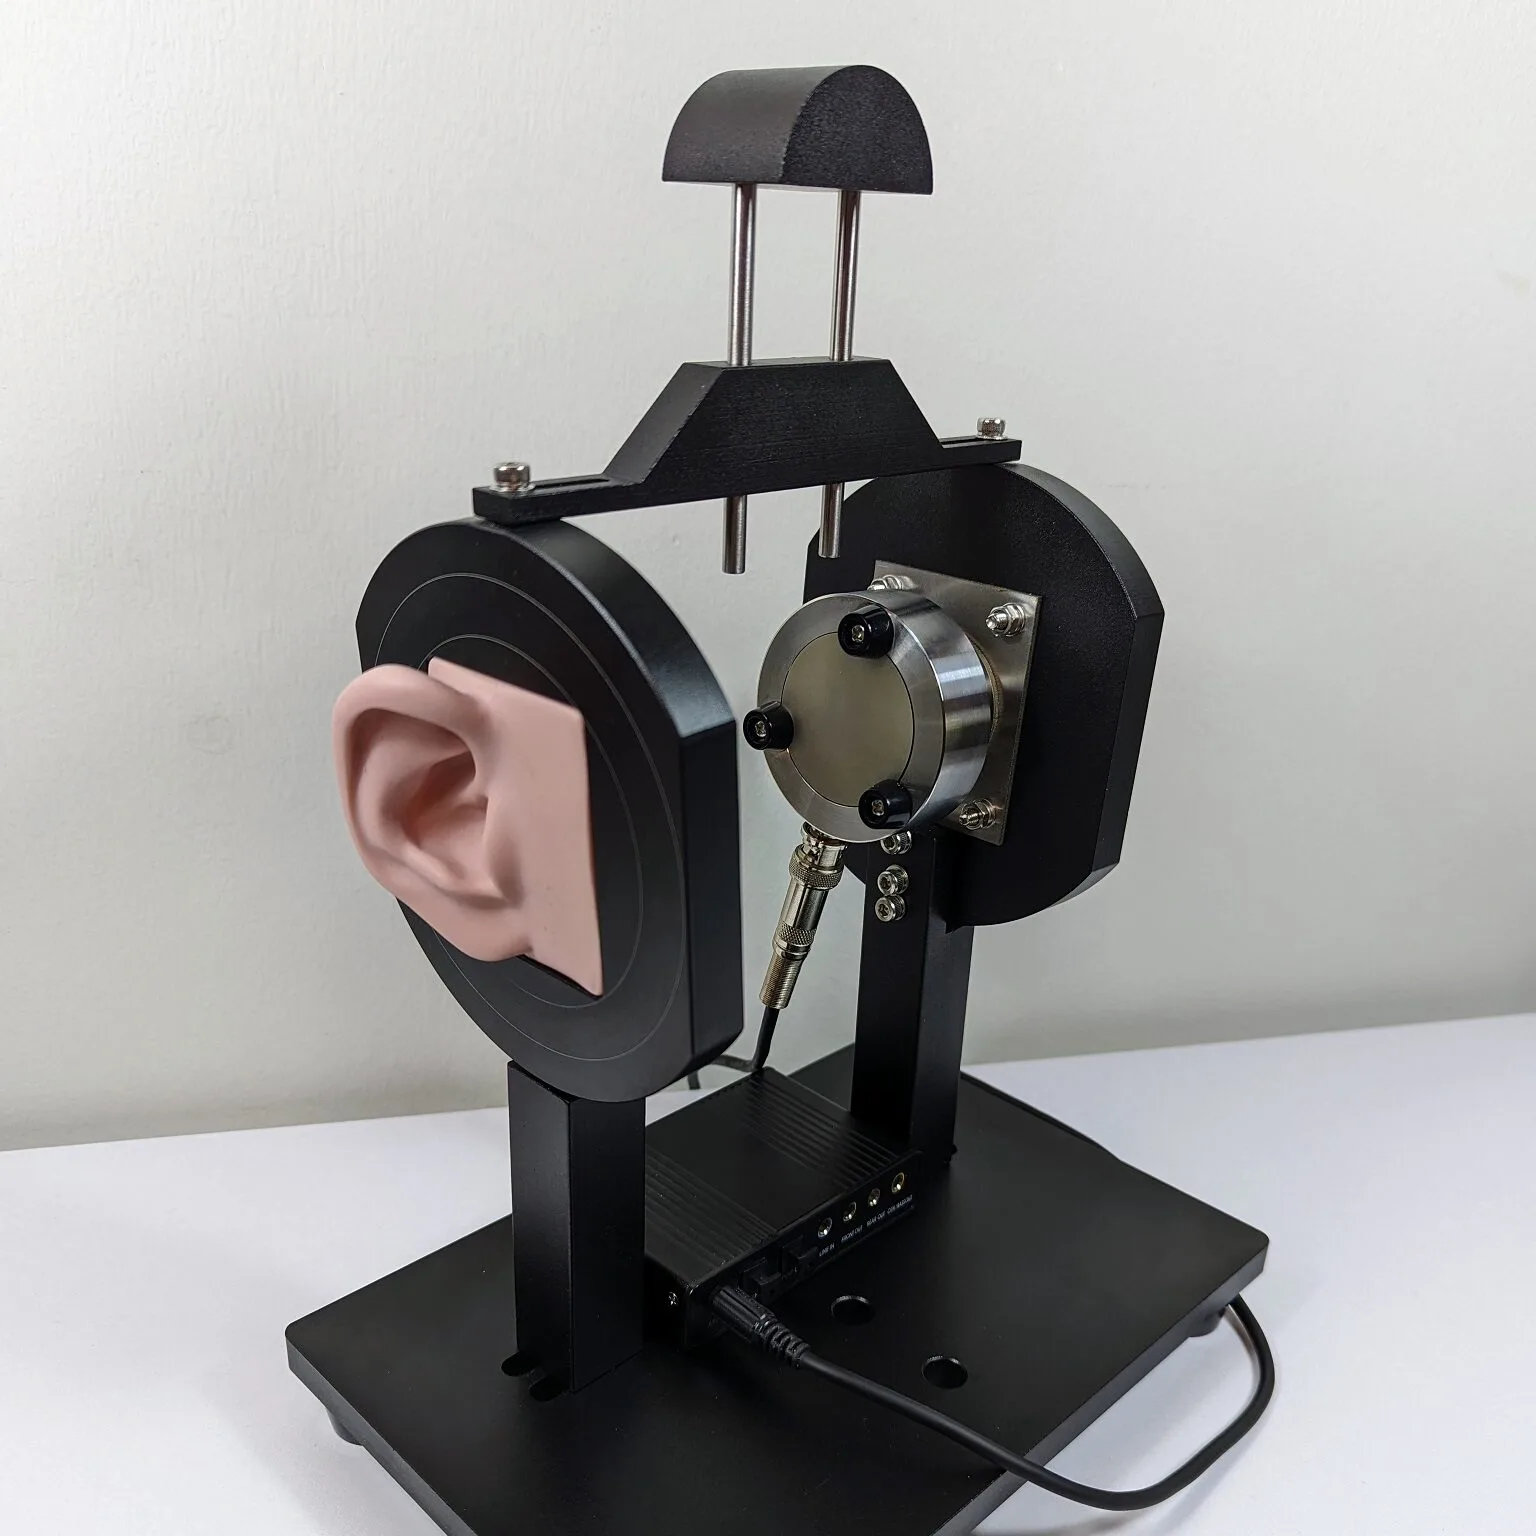
The metal frame of Headphone Corner's rig and its ears located approximately 15 centimetres apart ensure a consistent clamping force that simulates an average human head. This likely makes the measurements slightly more realistic and accurate compared to some other users of similar equipment who perform measurements with a single ear placed horizontally against a tabletop.
It should be noted that equipment based on the IEC-60318-4 standard are guaranteed to be accurate only up to 10 kHz. Results are inherently less accurate at frequencies higher than this, and strictly speaking, even the bass between 20–100 hertz is not measured quite as accurately as with newer B&K devices. This does not render the results at the extremes of the frequency band unusable, but for example, individual peaks and dips in the frequency response may be located at incorrect frequencies or their intensity may be unrealistic. Furthermore, the inherent resonances of the equipment's inner ear boost certain high frequencies unnaturally, so the measured frequency response at the highest frequencies does not entirely correspond to how a human ear hears the sound. On the other hand, frequencies above 10 kHz are less significant when evaluating headphone sound compared to lower frequency ranges, so their inaccuracy does not pose a major problem.
Furthermore, a recurring feature of the IEC-60318-4 compliant rig is a dip that appears in the measured response at 9–10 kHz, even if the headphones' response is actually flat at these frequencies. This is somehow related to how the headphones are in contact with the device and how the sound wave travels through the device's pinna into the ear canal. Therefore, the dip visible in the results can be mostly ignored; its existence can be interpreted as an expected and desired outcome because it means that the headphones do not overemphasize the 10 kHz frequency range. If this frequency range measures flat or elevated relative to surrounding frequencies, it means that the headphones have a treble boost. The frequency response of well-designed headphones often shows the dip I mentioned, when measured with an IEC-60318-4 rig. Unfortunately, this feature has not been taken into account in the Harman target curve, because it has been heavily smoothed to achieve a more visually pleasing presentation.
I have compensated measurement results made with the older pinna downwards by 1–4 decibels between 8–20 kHz (emphasizing above 10 kHz), because otherwise the highest frequencies were emphasized unrealistically. With the newer pinna, there has no longer been a need for treble compensation, as incorrect spikes occur less frequently. In some cases, the amount of treble in headphones measured with different pinna versions may differ quite significantly, so I recommend primarily comparing headphone models that have been measured using the same silicone ear.
A bite into Harman target curve
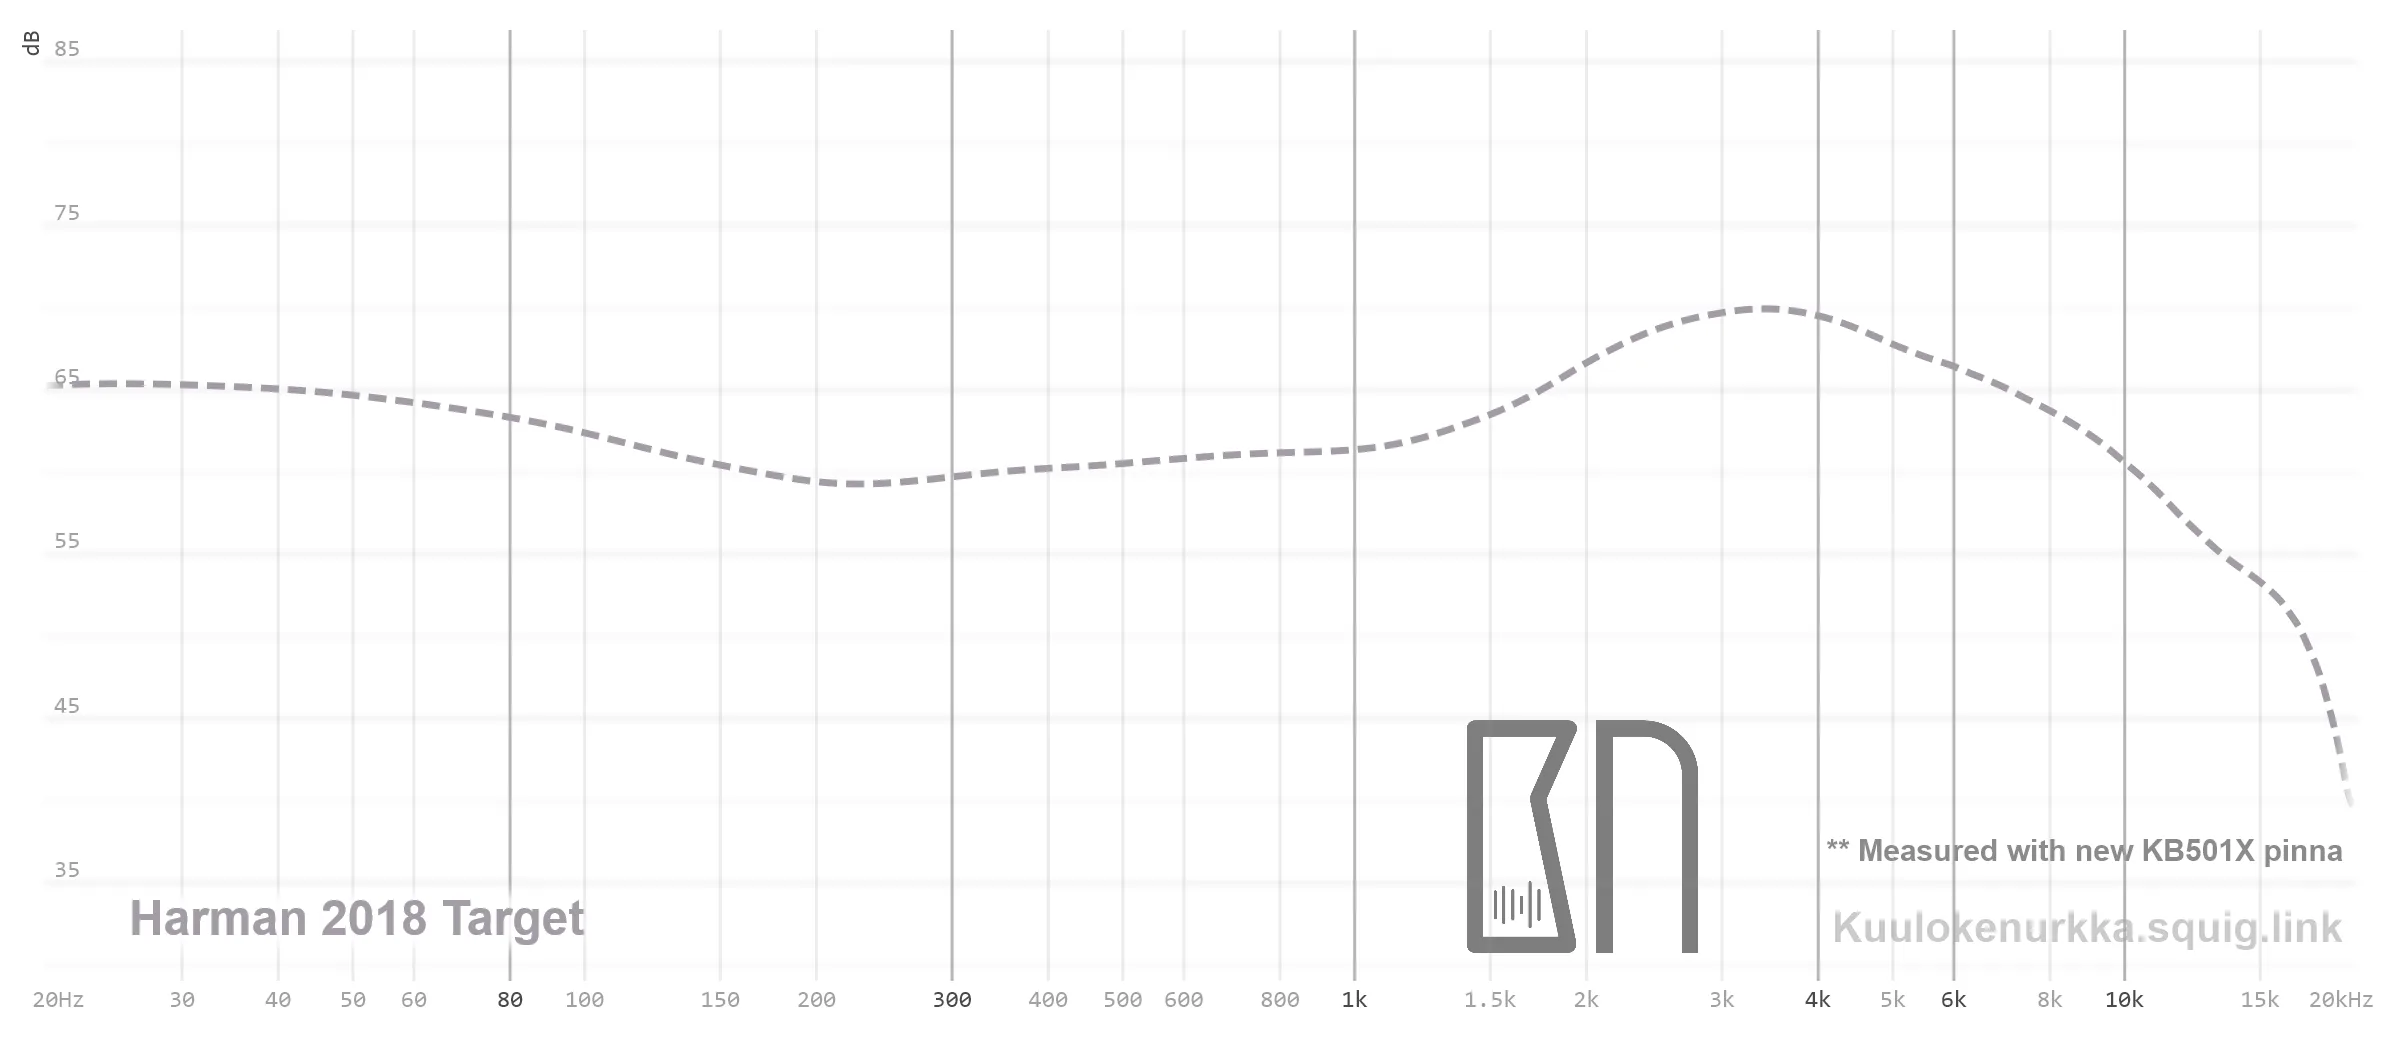
Frequency response measured with a rig compliant with the IEC-60318-4 standard can be compared to the Harman target curve, which was developed as a result of scientific research based on similar-ish equipment. The Harman curve can be considered a generalization of what kind of frequency response would sound good to most people with headphones. In other words, it imitates the response produced by a balanced loudspeaker in a good listening room, which is why such sound is generally considered quite neutral.
However, since the research conducted by Harman is based on the preferences of test subjects (trained listeners), the result must still be considered somewhat subjective. For example, many were observed to prefer strong bass, which is clearly visible as a bass boost in the final curve. The Harman curve is also an average, so it cannot take into account that some still prefer different level of bass or treble. Still, most consider the presentation of the mid-frequencies to be optimal for sound clarity.
The Harman target curve is not fundamentally intended to be an absolute truth (the research results have also been refined over the years), but rather a tool for headphone manufacturers when they are considering what kind of headphones would be worthwhile to produce for consumers. I myself would characterize headphones tuned according to the Harman target curve with the phrase "neutral and clear sound with strong bass."
When interpreting frequency response graphs, it is worth noting that the target curve has been heavily smoothed, while the frequency response of headphones is presented as accurately as possible with its peaks and dips. If the frequency response of headphones were smoothed as heavily as the Harman curve, it would also start to look considerably flatter. However, in this case, useful information about the characteristics of the headphones would be lost, so excessive smoothing is also detrimental.
I recommend looking at the general shape of the headphone's frequency response compared to the Harman curve, instead of individual small differences. If the frequency balance is quite similar, the sound of the headphones is likely easily accepted by the majority of people. However, it is worth noting that, for example, with open-back headphones, achieving the Harman style strong subbass is almost impossible without equalization, so a linear bass response does not mean that the headphones are automatically bad or unsuccessful.
Similarly, the amount of energy above 10 kHz in the measurements may appear even greater than the Harman curve, because the target curve is based on the similar equipment standard whose accuracy is quite insufficient at the highest frequencies. Precisely for this reason, the Harman curve slopes downwards after 10 kHz, as if to be on the safe side: when the upper frequencies of headphones align with the curve, they should not be too bright for most people. However, a little extra energy at these frequencies is generally not detrimental. Headphones can still sound good, even if the frequency response does not completely follow the Harman curve – preferences and hearing vary, and a measurement rig with inaccuracies does not always succeed in describing how the sound is perceived by human ears. Furthermore, frequency response does not seem to explain everything about the sound of headphones, although most of the final listening experience can be inferred from it.
Regardless of one's opinion about Harman's research and target curve, it is a useful reference point for evaluating headphone frequency responses and sound. The frequency response of headphones alone would be somewhat useless unless we know what the so-called "normal" sound is to most people when listening through headphones. When this is known, it is easier to identify and discuss the characteristics of headphones, whether it is a balanced sound or something unconventional.